
growing
like nuts
| |
|
||||||
|
growing
like nuts |
index | ||||||
|
|
|
||||||||||||||||||||||||||||||||||||||||||||||||||||||||||||||||||||||||||||||
| NOTE!
One day older accumulation data than shown on the present web page
(with month report data) have been provided in a separate Excel
file by VREG, status March 1, 2012. See section
II of the Year Overview section of Flanders market review! |
Older material on previous web page
Flanders/Vlaanderen: (23 graphs, incl. interactive)
2010 onwards - overview and details
Market growth 2011 - preliminary results table
Capacity
growth (MWp) and growth in Wp/inhabitant, incl. NL
Capaciteitsgroei
(MWp) en groei in Wp/inwoner, incl. NL 2
interactive graphs
PV
has most capacity installed in renewable electricity
PV grootste opgestelde capaciteit bij hernieuwbare stroom 1
graph
Distribution
among PV-installations >10 kWac
Installaties groter
dan 10 kWac in Vlaanderen: verdeling
(accumulating data and new installations/period, respectively)
3 graphs
Distribution
among PV-installations < 10 kWac
Installaties
kleiner of gelijk dan 10 kWac in Vlaanderen: verdeling 2
graphs
Average
daily new capacity per month in small and large category
Gemiddelde dagelijkse
bijbouw per maand in zowel kleine als grote categorie
3 graphs
Additions
to the >10 kWac list - status
Toevoegingen aan de >10 kWac lijst - status
Flanders - renewable electricity
mix shows clear PV component
Zonnestroom reeds duidelijk aanwezig in de hernieuwbare stroommix
5 graphs
More
details on Flanders PV market
Wetenswaardigheden over de Vlaamse PV markt
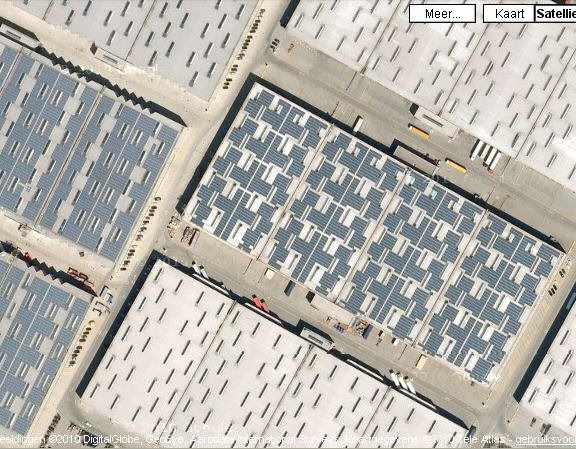
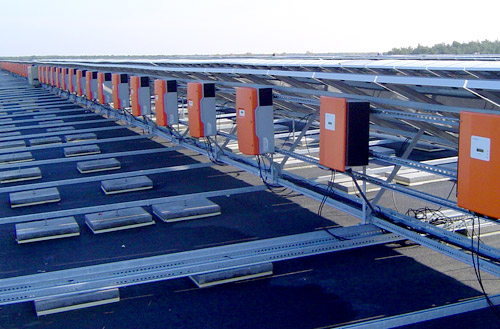
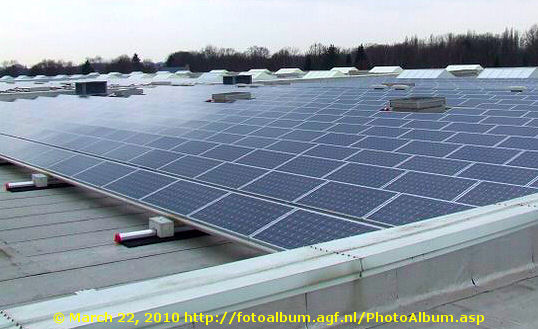
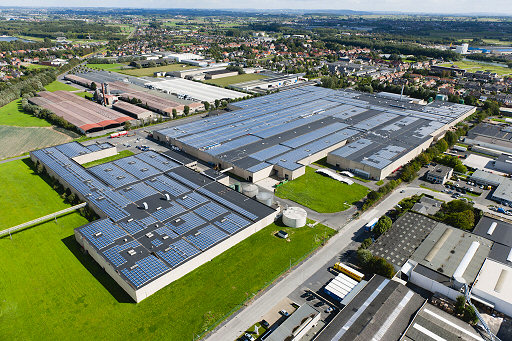
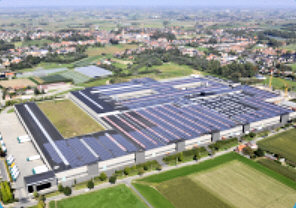
Photo's:
Harelbeke 5,004 MWp flat roof project by Orka
Loghidden
City first modules (Katoen Natie portion of 40 MW multi-site
project)
770 kW Juma Beton project in Lommel
1.014 kW Mechelse
Veiling project in Sint-Katelijne-Waver
Loghidden City video still
(from Invictus company video)
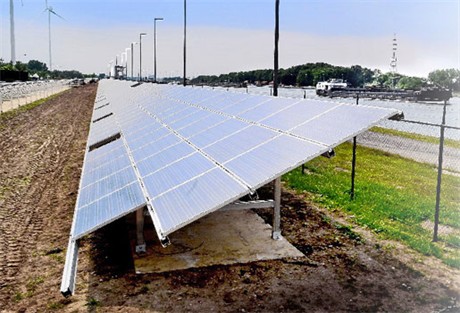
Solar power plants for locks
- example Albert Canal
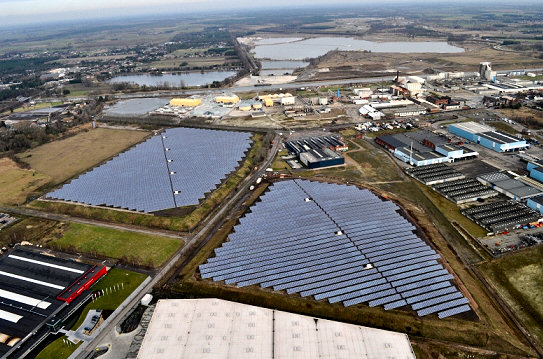
Biggest Benelux free-field
installation Nyrstar 7,6 MWp (or bigger?)
Small is beautiful - example
in the ancient heart of Gent
Specials:
Katoen Natie (2 graphs)
Map with private PV-installations
(map)
Big Players in Flanders (table)
Official
date of VREG approval for
projects >10 kWac (3 graphs)
>10 kWac projects
per net manager region (1 graph)
The rest of Belgium/de rest van België:
Wallonië/Region Wallonne (3 graphs)
Brussel/Bruxelles (2 graphs)
Estimation
for PV-capacity (growth in) in Belgium
Schatting PV-capaciteit geheel België
English
summary for 2010 on Solarplaza.com
(external link, status March 1, 2011, see also pdf)
English
summary for 2009 on Solarplaza.com
(external link, status April 1, 2010, see also pdf)
Voor
ontwikkeling Nederlandse markt zie de aparte
pagina NL
(For Dutch market details look
here)
*
Update resulting from last status report date-stamped February 1, 2012
on VREG site, and
older VREG data (year reports of previous years, monhly updates as of
Feb. 2011)
Vlaanderen/Flandres ("Vlaamse Gewest")
VREG - PV in Flanders (PV in Vlaanderen) update up till March 2, 2012 (downloaded: March 9, 2012)
Summary according to VREG registrations: Highlights: March 2, 2012 report: 1,5 GW AC capacity accumulation in Flanders surpassed. January 1, 2012 report: over 500 MWac market growth in 2011 established, already far beyond 2009 level; ING Equipment Lease portfolio surpasses 50 MWac. December 1, 2011 report: 23rd Katoen Natie subproject (652 kWp) in Western Schelde harbour region added. November 1, 2011 report: First new Katoen Natie project in Antwerp added. September 2011: > 1 GW of AC capacity formally registered with VREG. June-July 2011: probably 1 GWp of nominal DC capacity surpassed (Aug. 1: 969 MWac). March 2011: 100.000 PV-installations in Flanders surpassed. Biggest free-field PV-installation of Benelux included (6,2 MWac Nyrstar project). Accumulated capacity up till December 31, 2011 (VREG update/review March 2, 2012*): 1.538,258 MWac with 177.826 registered "installations"**. Average size of all installations: 8,65 kWac/entry. Accumulated capacity up till December 31, 2010, according to latest month report revision (ibid): 890,498 MWac with 98.228 registered "installations". Accumulated total capacity up till December 31, 2009 (ibid): 546,070 MWac with 65.300 registered "installations". 2011
growth - Preliminary market growth of installations explicitly
assigned to 2011 by VREG in the period January 1, 2011 up till December
31, 2011: 647,760 MWac with 79.598 Most probably due to degressions of the value of green certificates for solar electricity, the first one starting on July 1, 2011, market growth in Flanders has been remarkable as of May 2011. Many new large-sized installations were reported by VREG with date-stamps of official start in May and, in particular, in June 2011. In the March 2, 2011, report, for that last month only 734 new installations >10 kWac were reported by VREG with a capacity of 192 MWac (average size: 262 kWac per registered installation), with probably considerable backlog not yet published by VREG. Note that this volume already is 14% beyond the level of previous record month December 2009 (168 MWac). 2010 - Preliminary market growth for 2010, based on new data published by VREG as of March 2, 2011: 344,428 MWac with 32.928 "installations" (average size new installations 2010: 10,46 kWac/entry). Almost 46% (157 MWac) has been registered in December of that year. 2009 - Preliminary ("near definitive") market growth for 2009 (dramatically increased with respect to 2009 year report published May 2010, with only 245 MWac then known): 453,306 MWac with 49.963 "installations" (average size new installations 2009: 9,07 kWac/entry). Also, a large contingent of that volume (168 MWac, 37%) has been registered by VREG in the last month of that year (and formally accepted as such if the final grid connection for that volume was approved up till the end of February 2010). Total growth in period 2009-2010: 797,734 MWac with 82.891 newly registered entries (further changes expected with additional backlog being registered in future VREG reports, although large volumes are not expected). 2009 claimed 56,8% of the new MWac volume in those two years, but with all backlog capacities published by VREG in new month reports, 2011 has already surpassed 2009 with much larger volumes of newly installed capacity and installations. The March 2, 2012, report added almost 76 MWac of new capacity with respect to the previous month overview. 58 MWac of that new volume (76%) has been assigned to 2011. The rest has been assigned evenly to earlier years, 8,3 MWac, and only 9,3 MWac to 2012 (12% of new volume). Installations with a capacity of max. 10 kWac registered by VREG make up 54,0% of the (documented) Flemish PV-market and have an average size of 4,73 kWac. 3.382 (large-sized portions of) installations registered with VREG have an inverter capacity >10 kWac (status March 2, 2012). The biggest "single-site" installation remains the multi-roof Loghidden City terminal of Katoen Natie (Schelde West Bank) with at least 27,92 MWac inverter capacity (22 large sections). A first new large (1,02 MWac) solar Katoen Natie project in the Antwerp region east of the Schelde was added in the November 1, 2011 VREG report. Other developers did the same in the Antwerp and Gent harbour regions (e.g., ISP1-RG NV projects under the ING Equipment Lease umbrella). Heusden-Zolder 4,704 MWac Zonnecentrale Limburg NV, for a long time the largest free-field installation registered as such by VREG, has been replaced by a 6,2 MWac large entry for Zonnecentrale Overpelt NV (Nyrstar project) in 2011. Sofar, this free-field installation is the largest realised - and officially registered - project of its kind in the Benelux. In the September 1, 2011 report, two new installations of >4 MWac were added, the "Solar Tunnel" above a high-speed train traject near Antwerp, and 4,5 MWac Zonnecentrale Tongeren. * Still not definitive numbers. Data can - in particular for most recent years will - change in coming monthly overviews and year reports. ** Certified, registered with VREG, and prone to receive green certificates for the electricity produced. Note, that many larger PV-systems are not reported "as one system", but as two or more separate entries in the VREG registrations. The biggest "multi-roof" installation on one site, the huge Loghidden City Complex on the western Schelde shore (Kallo Kieldrecht, community Beveren-Waas), and part of the 40 MW Katoen Natie super project, has been split into at least 22 separate parts (varying in size between 210 and 1.804 kWac in the VREG reports) filed under the name of several daughter companies of the Katoen Natie holding (status: March 2, 2011). Similar split-ups appear in the Desteldonk area of Gent for the Katoen Natie project (the biggest segment a 2.220 kWac portion under the flag of Sabeen NV, a Katoen Natie subsidiary assigned to Sint-Kruis-Winkel in the northeastern Gent harbour region). Accompanied by a variety of other big installations not (directly) under the Katoen Natie flag, that have been registered by VREG under separate entries with their own code numbers. In the VREG reports, the "entries" are referred to in Dutch as "productie-installaties" (installations for production of renewable electricity deemed worthy of receiving guarantees of origin). |
Results from the market statistics produced by the "Vlaamse Reguleringsinstantie voor de Elektriciteits- en Gasmarkt" (VREG) for PV market development in Flanders. Statistics are frequently refreshed on VREG's website, but sometimes have lagged behind 1-2 months in recent years due to serious work overload at the regulator's office. Since April 2010 there has been a continuous update per month, although month reports can lag behind for a longer period. It must be emphasized here that older "numbers" reported by VREG can still be updated afterwards, as can be found in the [updated] year reports by the regulatory authority, and also, since 2011, in extensive, updated month reports. Hence: earlier published year accumulation for PV-capacity, can change as a backlog of installations not yet covered for that year is added even years later. This was particularly so for the data for 2009, that VREG first revised officially in their Feb. 28, 2011 month report (dramatically increasing capacity and installation numbers for 2009 compared to the original 2009 year report). This realisation made Polder PV update his earlier data on basis of VREG's yearly reports, and update his graphs published sofar. Updates will be further provided with each month report if time allows.
Graphs made by Polder PV from the principal VREG data (and other sources) are found directly below (roll-over image). Data for earlier years (up to 2004 from graph published by ODE, this webpage) have been replaced by new VREG data published since the Feb. 28, 2011 report. The latter report has been the first reference for new and more detailed analysis, which are augmented by new data in detailed monthly reports as of March 2011. Note: data in these graphs are only for the "Vlaamse Gewest", the Flanders territory excluding Brussels, and also not including the large French speaking Walloon region. See the separate sections for these areas on this webpage. A first analysis for the Belgium market "as a whole" has been published by Polder PV in articles published for the 2010 Solar Future Belgium symposium by SolarPlaza (original article here, pdf with graphs here). The version I wrote for the 2011 SolarPlaza Symposium can be found here (pdf can be found here). Recently, a new extensive status report has been published prior to the Solar Future Belgium '12 conference. This update can be found here (note also comments added below the report by the author; pdf here).
MWac,
not MWp
It is important to note that data published for the Belgium market
relate to maximum inverter capacity involved (kWac), and do not refer
to nominal STC power of the DC generator (kWp), as previously thought,
and still often suggested as such in the media. Polder PV, on asking VREG,
what accumulated MWp [STC] power could be on Flemish soil, got the reply
that this is unknown for many older installations, and that such data
have not yet been compiled by the regulator. A "standard calculation
factor" to obtain MWp power from the registered MWac data is not
used by VREG because of the uncertainties there-in (e-mail reply to webmaster
of Polder PV, March 8, 2011). If one would calculate in a conservative
manner, one could multiply the AC power in the tables and graphs with
a DC generator : AC inverter capacity factor 1,1 (hence: based on the
results published in the March 2, 2012 report, Flanders could have accumulated
1.549 (MWac) * 1,1 = 1.704 MWp of nominal DC power (STC capacity of PV-modules
involved). Earlier results published by VREG have revealed that somewhere
in June of 2011, the 1 GWp nominal STC capacity for photovoltaic installations
could have been "cracked" in Flanders. This remains, however,
an uncertain value as long as VREG is unable to provide more details.
Since VREG always adds new capacity for previous months, it is however
certain that the early summer of 2011 has been the "marker date"
for Flanders to reach the as yet exclusive club of "countries"
or "regions" (don't forget that Flanders is part
of Belgium!) that has more than 1 GWp of PV-installations on its soil
(e.g.: Germany, Italy, Japan, U.S.A. & Spain, China, France, and the
Czech Republic, see also analysis
of EPIA 2011 market report).
Note that reporting new PV capacity to VREG has become more strict, and that AC as well as DC capacity must be reported. The "problem" lies in the DC capacity for many older installations, that is still unknown.
For population data, the number of inhabitants for the Vlaamse Gewest only has been taken ("Vlaamse Gewest" app. 6,3 million, "Vlaamse Gemeenschap" including Brussels would have app. 7,3 million Flemish inhabitants, according to this Wikipedia site). Data for Flanders are compared with data available for the Netherlands in the graphs. For further information please contact the webmaster of Polder PV.
Total market
growth for Flanders in 2009
New calculations had to be done based on the additional
data published by VREG in their February 2011 report and in the later
revisions, in which the capacities per year were continuously updated.
Originally, VREG, published a volume of only 245,051 MWac and 47.273 new
installations for 2009, in their year report for that year (dated May
2010). This has been grossly adjusted in the new data and still is revised
on a monthly basis, although with minor additions in the second half of
2011 (in the order of 0,5-1 MWac per month). This is probably the result
of the fact that many installations have been mounted end of December
2009 without inverters, for which two months extra allowance time in 2010
had been given by the Flemish authorities ("transition period").
This to the effect of finalizing the PV-systems, and to be able to apply
for the "old" 45 Eurocents per kWh (green certificates value),
instead of the 35 Eurocents that became valid for all other new installations
as of Jan. 1, 2010 (up till the end of that year). Possibly VREG originally
counted (part of) those installations finalized before end of February
2010 as belonging to the "2009 cohort".
The latest VREG numbers in the March 2, 2012 year market update are impressive for the Dutch-speaking Flemish region in the relatively small country of Belgium: 49.963 new installations in 2009 (5,7% over the original year report 2009 value), and a respectable 453,306 MWac of new capacity (85,0% over the previously reported volume in the first year report...). Putting that volume equal to 1,1 * 453 = 498 MWp DC capacity, that would roughly be a factor 47 as much as the absolute "growth" in PV capacity (10,7 MWp in 2009, first data CBS) in the (whole of the) Netherlands bordering Flanders in the north.
Year growth
Flanders market
In the graphs presented below I will first give the latest year
results (or: predictions) up till 2011 from the most important sources
for the Flemish market: regulator VREG and (latest data, updated after
an almost year
long "stall" of these important numbers) branche organisation
PV Vlaanderen (former BelPV). All graphs give AC power of installations
(note: deviating from common practice in Germany, where DC power capacities
are published, "Generator Leistung" in kWp, MWp, etc.).
 |
ROLL-OVER
IMAGE. Mouse pointer away from the image shows the
most recent available data from the standard monthly reports by
VREG (revised year data renewable electricity generation capacity
as of March 1, 2012†), and the
data presented by PV-Vlaanderen (former BelPV) branche organisation
in their completely updated "Marktgegevens / cijfers"
section (higher than the numbers in their report "Zonnige toekomst
voor Vlaanderen", publ. January
2012). Mouse pointer over the image shows earlier data from
VREG's year report 2010 (publ. August 5, 2011), and older data by
PV-Vlaanderen that could be found for a long time on their website
in 2011 up till February 2012 (see
also my comments).
For 2010, changes are remarkable, as they were before for 2009. The 2009 year report capacity data have been revised dramatically in the 2010 VREG year report (published August 2011). Older prognoses from PV-Vlaanderen have always been to low, such as happened with branche organisation's estimates in other booming solar markets. The old data that PV-Vlaanderen had on their website for a long time (green columns when mouse pointer is over graph) could still be found on their website in December 2011. They did, however, finally revise the VREG data in their short market overview in November of 2011 (under "cijfers"). The numbers in a separate report, "Een zonnige toekomst voor Vlaanderen", published January 2012, are, however, also outdated ("2010: 316,6; 2011: 430 MWac"). The data presented on their website in March (green, mouse pointer away from the graph) do also not show actual status published by VREG. Numbers for 2011 will certainly increase further as VREG will report more on their backlog entries for that year in the coming months, such has happened for 2010 in the month reports in 2011. Note that capacity in graphs and text is in AC power unless specified otherwise (maximum inverter power of the installations involved). Total installed nominal generator power (MWp STC tested power of all PV-modules) is as of yet unknown for many older installations by market regulator VREG, but could conservatively be taken as 1,1 times AC power. † Data taken from the standard month report, published March 2, 2012. Note that VREG also published a preliminary Excel overview with year data for 2011 dated March 1, 2012, with slightly lower numbers as those in the detail report highlighted on this webpage (e.g., 641,6 MWac accumulation in 2011). See analysis by Polder PV on the separate webpage. |
Yearly added new PV-capacity (grid-connected) in Flanders completely revised by VREG, in their March 2, 2012 month report (mouse pointer away from graph). The changes with respect to previous known "officially published" numbers (mouse pointer over the image) are remarkable for the year 2010: Following data from the year report 2010, VREG originally published preliminary new capacity of 253,8 MWac for 2010. This has been changed into a considerable higher 344,4 MWac in the March 2, 2012 update (almost 36% more capacity than previously published). Even the originally published new capacity for 2009, 445,8 MWac, had to be revised accordingly: the adjusted new capacity published for that year in the March 2, 2012 report now has been adjusted to 453,3 MWac, 1,7% more capacity. Although in theory still volume might be added, it is expected that this will only be a minor volume; the biggest changes in the statistics for a certain year become apparent in the following year.
Branche organisation PV-Vlaanderen (previously BelPV) for a long time implied 412,7 MWac for 2009 (mouse pointer over graph) in a graph originally published in February 2011 (and still on their website up till February 2012), and a preliminary 165 MWac for 2010. They have only recently adjusted market data for 2009 and, in particular for their "way-off" data for 2010. End of 2010 PV-Vlaanderen predicted a small "end-of-year-rush" of possibly 80 MWac in December 2010. Up till the March 2, 2012 report, however, only for the >10 kWac category already 653 installations (or registered portions of large systems) have now been officially designated to that final month of 2010, with a total added capacity of 156,7 MWac. Hence, BelPV apparently published an extremely conservative prediction in contrast to what I thought earlier. The strange thing is, that Jo Neyens of BelPV has been one of the approximately three-thousand people, organisations and companies (status: Jan. 20, 2011) signing the petition to the Flemish government ("Laat de zon schijnen" - "Let the sun shine") to prevent harsh degression measures for the coming feed-in tariffs for PV. In that well-written document, dated November 25, 2010 (one of the authors works for the well-known PV-system planner Enfinity), the old market data by VREG (that I originally took as a basic reference) were also used for the calculations (pages 7-8 of the pdf available through that website). There they also took the VREG year report 2009 data, and the following month reports as "true market data" to calculate the probable volume of kWh's produced (and green certificates to be issued) based on that market growth. It is now apparent, that many calculations will have to be revised since much larger volumes have already been reported in the continuous updates published by VREG.
Preliminary monthly growth Flemish PV-market 2011, status March 1, 2012
Taking the continuously revised new monthly VREG data for PV-installations and capacity assigned to 2011 (March 2, 2012 report, with data up till, and inclusive, Feb. 29, 2012), the following picture emerges:
 |
^^^ Accumulated AC capacity for 2011 (dashed) will further grow as new monthly reports by VREG will become available in 2012. Also, the capacity for 2010 and earlier years still can be adjusted afterwards as VREG will still assign installations to those years (expected: minor volumes). Note that in 2011 (more precise: app. June-July), the barrier of 1 GWp accumulated nominal (DC) capacity of PV installations has been broken in Flanders (red line). The 1,5 GWp "barrier" may have already been passed end of 2011. For 2012 data are not yet encouraging. Only 9,3 MWac has been recorded, which brings accumulated capacity at 1.692 MWac, or 1.704 MWp DC for Flanders. |
In this graph end of year (up till 2010) and preliminary 2011 accumulations have been shown. With all 12 month reports by VREG for 2011, the additions in the March 2 report in 2012 (with 58 MWac allocated to 2011), and the revisions there-in, accumulation of all registered installations already has become 1.538,3 MWac. With the addition of a meagre 9,3 MWac assigned to 2012, this adds up to 1.549,385 MWac. If one would take 1,1 as a conservative multiplying factor to calculate the possible DC generator power involved, this could amount to approximately 1.692 MWp end of 2011, and 1.704 MWp with present known 2012 additions (STC power of all PV-modules), as shown in the light blue "open" column on the right for end of 2011. Already far beyond the "magic" 1 GWp (DC) volume that only few other markets - in much larger countries - have reached, reaching out for the next magic barrier, 2 GWp. With an important note: this only concerns Flanders, the Walloon region and Brussels (much smaller partial Belgium markets) are not yet included in these numbers.
According to a recent prognosis by Apere (with preliminary estimates), these much smaller Belgium markets could have added 2011 volumes of 94 and 0,7 MWac, respectively (reaching accumulative capacities of 186 and 6,6 MWac, the Walloon market has doubled). The latest reviews of CWaPE (publication date end of Feb. 2012) show that new capacity in 2011 already could have been in the order of 107 MW (capacity there is given in kVA, kilovoltampère). Only a small volume, 7 MW, consists of installations >10 kVA.
2011
onwards - overview and details
The market segment >10 kWac (status March 1, 2012)
could be analysed in detail. For the first time, in the January 31, 2011
issue, the long installation list (pdf of January 1, 2011 report containing
140 pages) was published as an Excel file. After reworking that file,
it was much easier to compare that listing with the previous one and extract
from the differences the growth data in the intermittent period. Regrettably,
later reports again were pdf files, again later accompanied by Word documents.
With some conversion steps these could be used in updated Excel files
and a comparison with the previous list could be made. This remains, however,
a laborious task demanding meticulous attention. There has been some confusion
with the June 2011 report, for which no Word document was made available.
Therefore, the pdf was screened by Polder PV to extract the new installations
(as of August 2011 again Word documents have been published). Sometimes,
this list is published asynchronously with the other actual data reported
by VREG (e.g., the November 1, 2011 listing was made available only in
the third week of that month).
The accumulated volume for >10 MWac installations ("registered entries") in the March 2, 2012 report consists of 3.382 registrations with an accumulation of 714,2 MWac of inverter power, and an average system (or "entry") size of 211 kWac.
Small system
size/accumulation
Taking the accumulation of installations >10 kWac counted
by me (and included in detailed spreadsheets), and subtracting that volume
from the separate "accumulation for all renewable options" listing
by VREG, it is possible to calculate the share of the installations up
till 10 kWac ("small market segment"). In the March 2, 2012,
report that segment seems to represent an accumulation of 176.710
installations with 835,1 MWac of installed capacity
and an average system size of 4,73 kWac. Calculating
with a factor kWp = kWac * 1,1, average STC generator (DC) size for this
important category could be 5,20 kWp (26
modules of 200 Wp each on a family house).
Growth numbers
PV-categories big and small
Reporting from the results from the last months ("installation"
meaning: "entry registered in the VREG records"). Note that
additions often are assigned to earlier years, up till now only a small
portion of those additions has a date stamp in 2012 (!):
January 2012 (between Jan. 1, 2012 and Jan. 31, 2012): 148 installations >10 kWac with 36,56 MWac (average size of 247 kWac/installation) added. Growth for the market segment up till 10 kWac has been 7.577 new installations with a size of 47,29 MWac (average size app. 6,24 kWac/installation). Total "VREG-registered" additions in 31 days has been a very good 83,85 MWac and 7.725 new installations, or 2,70 MWac (249 installations) a day. February 2012 (between Feb. 1, 2012 and Feb. 29, 2012): 220 installations >10 kWac with 51,11 MWac (average size of 232 kWac/installation) added. Growth for the market segment up till 10 kWac has been a relatively low 4.727 new installations with a size of 24,59 MWac (average size app. 5,20 kWac/installation). Total "VREG-registered" additions in 29 days has been a good 75,70 MWac and 4.947 new installations, or 2,61 MWac (171 installations) a day. |
Growth rates in Flanders still remain much bigger than in the neighbouring Netherlands, that realised only approximately 11 MWp DC capacity of certified installations in 2010, and a volume of over 9 MWp of non-certified PV-systems in that year (total: 20,4 MWp grid-connected plus 0,3 MWp autonomous systems) according to data released by CBS / StatLine (summer of 2011; data accuracy questioned by Polder PV) in combination with earlier published numbers from CertiQ. For 2011 up till March 1, 2012 only the preliminary "certified" volume is known, 25,3 MWp. If 35% of new year volume has been realized without certification (comparable to the level of 2010), total year volume in 2011 could reach a level of 33,0 MWp, of which 11,6 MWp might be uncertified. This is only a fraction of the actual Flemish market volumes.
Market
growth 2011
Since the Feb. 28, 2011 report several new data have become available
in various new documents on the VREG website. One of the most interesting
of these is the "adjusted" volume listing per year (since 1985),
with the latest available data for the number of PV-installations newly
installed in the year under consideration. And considered eligible for
receiving green certificates by VREG. The original year of installation
is the marker date in these documents. Later expansions of installations,
a practice common with a growing number of PV-owners with appetite for
more, are considered separately. If that expansion has an official installation
date in a later year, it is assigned to that year.
For the evolution of the data in these lists (Feb. 28, up till March 2, 2012 reports), I constructed this detailed Excel table in which the "backlog" assignment per year can be followed in detail, for number of installations as well as for their accumulated new capacity:
(Graph/table
above, CLICK on image for
enlargement)
In this screendump of another spreadsheet a comparison is made between
the listings of PV-installations assigned to their (first) year of installation
as approved by VREG in the subsequent month reports (Feb. 28, Apr. 5,
May 2, June 1, July 1, August 1, September 1, October 1, November 1, December
1, 2011, January 1, 2012, February, 1, and March 2, respectively, from
right to left). In red numbers, changes are given with respect to the
data provided in the previous month report. Sometimes even negative numbers
result from that subtraction (e.g., for - small - PV-capacity changes
in earlier years), possibly referring to removed or destroyed installations
(or otherwise unknown factors).
However, the most significant changes are positive, and sometimes dramatic for the years 2009-2010 and, of course, 2011. For the last report (March 2, 2012), changes were again almost exclusively for the years 2009-2011: 267 kWac (2009), 8,000 MWac (2010) and again a considerable new volume of 58,145 MWac for 2011. Plus 0,06% (2009), 2,4% (2010), and 9,9% for 2011 with respect to the accumulated capacities in the previous month report. 2012 saw its first additions, still a very moderate new volume of 9,305 MWac. It remains to be seen how the market will develop, with another new degression of the value of green certificates already in place (Jan. 1, 2012).
From the detailed table follows that in total 75,7 MWac of "accumulated PV-capacity" has been added in the latest, March 2, 2012, report, with 4.947 new installations. And that the largest part of that volume, 58,1 MWac (3.096 installations), 76,8% of the new capacity reported by VREG, has been added to the previous volume of 589,6 MWac accumulated for 2011 in the February 1, 2012, report. The second largest volume has been assigned to 2012 (9,3 MWac or 12,3% of new volume in the latest report). The - minor - rest has been assigned to 2010 (8,0 MWac / 10,6%), and to 2009 (267 kWac / 0,35%). Some small changes (deleted capacities) have occurred in earlier years. Still, more installations can still be added afterwards, in particular to 2011, but even - in small volumes - to the years before. It is to be expected that growth volumes of 2011 will turn out to be even much stronger than shown in the present update. And, of course, that 2012 volume will rise sharply, with flat and low module prices and overcapacities in the global market.
Up till the March 2, 2012 report an accumulated new capacity of 647,8 MWac for 2011 has now already been documented. Which is a strong 88% over the new volume in 2010 now known. And already 43% more than the previous record year 2009. Hence, in contrast to what might haven been suggested before, 2011 has been an excellent year of PV-market growth for Flanders, despite the already implemented feed-in degressions. This has been regulated as a diminishing value of the green certificates obtained from the regional net managers by the PV-system owners, with degressions as per January 1, July 1, and October 1, 2011. Leaving only 9 Eurocent/kWh for installations >250 kWac, and, as per Aprl 1, 2012, 23 Eurocent/kWh for smaller installations.
Calculating with a factor 1,1 to obtain an estimated new DC capacity for Flanders in 2011 (713 MWp), this - still "preliminary" - volume for 2011 is probably almost a factor 35 times that of the accumulated new volume (20,4 MWp grid-connected) in the twelve months of 2010 in neighbouring Netherlands (which has a population 2,7 times bigger than that in Flanders, later CBS data not yet available). With more capacity to be added on the horizon.
Graphs Flanders PV market as compared with Netherlands.
With the January 1, 2011 report, it has turned out that the VREG registrations have resulted in a historical "marker" event: Flanders surpassed the ("official") 100 Wac/inhabitant accumulated installation milestone in that report (with later revisions bringing more capacity for earlier years that marker shifts to a point earlier in time). With respect to the March 2, 2012 report, with 1.549 MWac of registered capacity, the 6,25 million inhabitants of the Flanders region (exclusive of Brussels) each had 247,8 Wac virtually installed solar inverter capacity. Using a factor 1,1, this could result in a virtual, average, modern, powerful 273 Wp PV-module on the roof of each inhabitant. For preliminary data up till 2011, see the interactive figure given below. In this figure also the deplorable situation in the Netherlands becomes evident once again (green columns), with only approximately 6 Wp/inhabitant at the end of 2011. Even if the as of yet totally unknown "non-certified volume" for that year is taken into account as an optimistic, and speculative 20 MWp (total new volume for 2011 put at 45 MWp incl. 21 MWp certified/CertiQ, and including 10 MWp non-certified "Wijwillenzon" projects, capacity additions uncertain), accumulation end of 2011 would reach only 128 MWp, and in Netherlands only some 8 Wp per inhabitant would materialise. Only 3% of the per head volume in Flanders...
It is important to emphasize that Flanders has started only seriously in 2006 with PV market expansion as the first feed-in legislation was introduced in that year. Netherlands already has considerable experience with PV-installations since the end of the nineties of the previous century, with famous, internationally renowned (and very expensive) projects. However, stifling political desinterest, powerful, natural gas and nukes loving bureaucrats with their own "visions" of the energy future, and continuous sabotage by parties deeply involved in fossil-based energy generation has prevented succesful implementation of "working" legislation. As a result, Netherlands has fallen back onto the 14th position in accumulated volume of PV in EurObserv'ER statistics in 2010.
Accumulation
up till 2011
The following graphs are updated with the data from the March 2, 2012
report. The numbers give the extrapolated MWp nominal capacity (hypothetical
factor: MWp = MWac * 1,1) based on the published month reports by VREG.
For Flanders, in particular the accumulation for 2011 still can change
considerably. The Dutch data up till 2010 seem to be more or less "fixed"
by CBS, but the webmaster of Polder PV has doubts concerning the accuracy
of those data since most PV-systems in the Netherlands are never monitored
and many thousands of small installations have never been officially registered.
The data for 2010 apparently have not changed (CBS data update
in September 2011).
2011: preliminary
results (NL: 2011 only including known certified capacity)
ROLL-OVER IMAGE (above).
Moving the mouse pointer away from the image shows the absolute grid-connected
PV capacity accumulation per calendar year, as provided in monthly reports
(note: most recent data can change afterwards). Note that capacities
are given on a logarithmic Y-axis! Given directly in MWp by CertiQ in
Netherlands, but calculated by Polder PV from the AC power registrations
by VREG for Flanders by multiplying those data with a factor 1,1*.
All installations certified for Flanders, but only a relatively small,
app. 33% portion (end of 2010 over 29 MWp out of accumulated volume
of 88 MWp) certified for the Netherlands. Status for 2011 is not yet
known, only certified new capacity could be extracted from CertiQ data
(also not yet certain): 21,5 MWp. Dutch data show "final"
data up till 2010 (CBS year report,
not changed later). VREG data for 2011 are also expected to be revised,
as well as data for earlier years, although the latter will only change
with small volumes.
Moving the mouse pointer over the image gives the calculated capacity accumulation per inhabitant ("per capita" or "pp."), also with a logarithmic Y-axis scale. Both images show strong growth of the Flanders market as compared to the sluggish development in the Netherlands in the last years - even under a so-called new "incentive" regime ("SDE"). Calculated accumulated grid-connected capacity for Flanders end of 2011, based on revised data in the March 2, 2012 report: approximately 1.692 MWp of nominal (STC) capacity (1.538 MWac accumulated AC power). A roughly estimated 16 times as much as the capacity that might have accumulated for grid-connected PV-systems end of 2011 in the Netherlands (exclusive not yet known uncertified installations for that year).
Accumulation
2011
In the next, mouse-directed roll-over image progress in 2011 is monitored,
based on the accumulation data given by VREG in the separate month reports
for all renewable electricity generating options. Since in those reports
the older progress data (for previous months) are not updated, the first
reports of the year always have "outdated" accumulation data.
Hence, for the January 2011 accumulation the outcome (an estimated 737
MWp in published month report) is - considerably - lower than the estimated
"updated end of 2010" value (see graph above: 980 MWp). Therefore,
the results for the previous month reports in 2011 have been given in
hatched columns. The final month gives the "preliminary actual
status" derived from the most recent month report analyzed here,
the one date-stamped March 2, 2012.
 |
ROLL-OVER IMAGE (above). Moving the mouse pointer away from the image shows the DC grid-connected PV capacity (MWp) accumulation per month in 2011 (up till Jan. 2012), as provided in monthly reports (note: most recent data can change afterwards). Note that Y-axis is at a normal scale (previous graph is with logarithmic axis!). For Netherlands, the non-certified, not centrally-registered volume added in 2011 is as yet completely unknown. Only the installations officially registered at the CertiQ office are known and published on a monthly basis. These are exclusively PV-systems having a certified production meter ("bruto productie meter", for the old MEP and, in particular, SDE incentive regimes).
Poor
market conditions Netherlands >> low growth rate PV
The Dutch (NL) PV capacity accumulation is uncertain. The last data
for 2009 has been 62,5 MWp of grid-connected installations (CBS year
report). The new StatLine data and the CBS year report 2010 give almost
20,4 MWp of new grid-connected volume for 2010 (based on a questionable
once in a year "request for information" with only a selection
of installation companies). Which brings the accumulated grid-connected
volume at
82,7 MWp, end of that year. The accumulations for the months in 2011
given in the graph above are the 82,7 MWp mentioned plus the new certified
additions by CertiQ in their continuing month reports. At the start
of March 2012, still only 108,0 MWp of grid-connected PV-capacity has
accumulated. With unknown "uncertified" MWp's missing since
the start of 2011, that have never been registered in a central database
anywhere. In view of developments on the "uncertified" market
in Netherlands (possibly 35-45% of total market installations in 2010),
finally the long-awaited threshold of 100 kWp of installed accumulated
capacity might have been reached earlier in 2011. Although it is impossible
to tell when exactly that long awaited "mile-stone" might
have been reached (presumably somewhere in June or July)...
Note that apart from that segment, up till 2010 only 5 MWp of autonomous systems were accounted for in the Dutch CBS data (with an apparent decrease from max. of 5,3 MWp in 2007). These poorly known off-grid systems are not taken into account in my reports for the grid-connected market, which is dominant in all aspects.
Comparison of market development of grid-connected PV-installations in Flanders (blue) versus the known volume in the Netherlands (light green dashed columns) is shown in the graph above. The new "incentive" regime in the Netherlands (SDE, started on April 1 2008, in essence a combination of net metering [poorly documented in Law since July 2004, even in an upgrade earlier in 2011] and a variable feed-in allowance changing each year) is so bureaucratic and full of various restrictive market caps, that progressive, strong growth has remained an illusion. The fourth regime, SDE 2011, has depleted it budget at the beginning of 2012, but almost all capacity has yet to be realized. Including the 50 MWp "approved" PV projects that would receive only a few Eurocents subsidy per kWh produced on top of net metering. If that is possible, since this can only be achieved on premises with a connection capacity up till 3x 80 Ampères (this could mean that PV-systems cannot go far beyond 50 kWp to be able to comply for net metering).
From renewed calculations of published graphs (new calculations published here) only app. 6 MWp had been included in 2009, and approximately 11 MWp in 2010. Newly added certified volume in 2011 has been over 21 MWp (preliminary CertiQ data that might be adjusted). Most probably, this volume will increase slightly, since "permits" issued by Agentschap NL dictated a realisation date in 2011 for many installations, and realized volumes may be adjusted in a later year. However, many allowances will possibly never materialize for a number of reasons. Market conditions for photovoltaics in Netherlands remain deplorable, in particular for bigger projects.
From the start of the lottery that the SDE regime has been for PV, a growing number of system buyers did not even apply for the new SDE subsidies in the Netherlands because of stifling bureaucracy, and many uncertainties. An increasing number of people and companies have acquired uncertified, mostly unreported PV-systems and still do so in increasing numbers, triggered by ever lower module prices and increasing awareness for solar energy among Dutch civilians and smaller companies. In their year report for 2010, CBS published data resulting in approximately 20,7 MWp of capacity sold to installers in 2010, 20,4 of which would be grid-connected. That suggests that app. 46% of capacity sold did not enter the CertiQ database (year report: app. 11 MWp new in 2010). In addition, it must be stressed here that those installations do not have a certified production meter, and that the green electricity produced is probably not registered in any central register.
The new conservative, nuclear fission loving minister for economic affairs in the Netherlands, Maxime Verhagen, dictated end of November that in 2011 all state-induced incentives for "small-scale" photovoltaics (up till 15 kWac) would be completely abandoned (excluding the remaining, poorly regulated net metering), and that the economic basis for incentives for larger installations would turn out to make that a negative business case for almost all projects if no other financial incentives (mostly taxation profits: EIA, VAMIL, MIA) can be found... A plethora of - often short-lived - new "market initiatives" has emerged since then. The national PV-market is in total chaos, and an initiative for buying cheap Chinese modules and inverters (app. 13-14 MWp suggested early in 2011) by a foundation (Urgenda / Wijwillenzon.nl initiative 2010-2011) has met with strong criticism by - mostly experienced - installers. These installers feared that their hard-earned market shares are out-competed with heavily subsidized Chinese hardware dumped on the ever-small Dutch market. Some 6 MWp of that volume (for private house owners) would have been realized in a few months time, starting in May 2011. Actual realisation data of this initiative remain enigmatic, the initiative has been extended "for one more time", after which it would be stopped ("the market has to pick up the idea of collective import", so it is said, several "initiatives", each with its own peculiarities, followed soon...).
Since then, the "collective buyer" actions have exploded in the Netherlands, many in the eastern province of Overijssel giving a lot of extra incentives. On March 28, 2012, I have counted already 42 (!) collective buyer projects, varying from small to relatively big (e.g., "Zon Zoekt Dak" could generate over 10 MWp, if all reservations will lead to orders). All these projects will not deliver "certified" installations that should become known to CertiQ. Hence, it is possible that far more "uncertified" capacity will be added in 2012 than the SDE projects ("certified", and with "bruto productiemeter") might bring.
In
contrast
Flanders has introduced an exceptionally attractive package of
"Germany-like" (certainly not identical) kWh incentive for 20
years (up till 2009 45 eurocent/kWh, fixed tariff for existing installations,
lowered to 35 eurocents/kWh in 2010, 33 eurocents/kWh up till end of June
2011 for installations <1 MW. As of July 1, 2011, the scheme encompasses
30 eurocents/kWh for installations <1 MW, and 24 eurocents/kWh for
installations >1 MW. With further strong reductions as of October 1,
2011, and January 1, 2012, already decided
upon, and, in the meanwhile, implemented as such. April 1 a next degression
step will be implemented.
This, added with accompanying net-metering up till zero on a yearly basis for the smaller installations (max. 10 kW inverter output), and, for a long time, very interesting tax incentive measures (these have, finally, been abolished for smaller installations in the new year). The Flanders market started to grow like nuts in 2008-2009, as revealed by updates by VREG, showed slower, but still good growth in 2010. Even with the strong, step-wise degressions of the value of green certificates, market volume for 2011 is already much bigger than that in 2010. In 2011, "social cost" discussions (hotly contested by branche organisation PV-Vlaanderen) have eroded political will to further support photovoltaics forcefully. The social Minister Vandenbossche has openly "admitted" that PV in Flanders has grown too fast, that strong support for developing PV apparently has been "a mistake", and she has pleaded openly for more wind power on Flemish territory.
"Vlaanderen is een “energetisch ontwikkelingsgebied”." Willy Lievens van educatief centrum Zonne-arc, in een artikel over zijn initiatief in Duurzame Energie van augustus 2001, en aanhanger van de Trias Energetica (besparen boven alles), zal mogelijk zijn mening daarover enigzins hebben bijgesteld anno 2011... |
Flanders: PV has most capacity installed in renewable electricity
© Data VREG, March 2, 2012 report
(Graph
above)
Already
in the end of November 2009 report by VREG, solar electricity had
reached the largest nominal electrical capacity of all considered
renewable options in Flanders, and its impact has increased further
up till the end of January 2012. Output in kWh, of course, is much
lower in relation to other renewable options because of the relative
low specific production per kWac (PV installations are unable to produce
anything at night, it's in their "nature"). However, this
graph shows how large the impact on the "renewable electricity
market" has become with respect to photovoltaics in this relatively
small, Dutch-speaking part of Belgium. A sizeable 58,3% of total "nominal"
capacity (2,66 GWe) installed is the most democratic type of electricity
generation, "power to the people" PV.
Renewable electricity generation from wind on land (blue column), which temporarily took over the second place in July 2010 with the report of 4 new facilities, has fallen back to a 3rd position according to the VREG data. Only 46 MW of windpower has been added in 2011, but the March 2, 2012 report added a good 39 MW (3 new projects). It is expected that, with the building of an off-shore wind parc (and increased political support for wind on land over solar by Flemish authorities), this situation could change dramatically in the near future. There is, however, also a highly controversial old coal-plant that is refurbished by co-owner Electrabel as a pure "biomass-firing" plant fed with imported Canadian wood chips. This company, having a rather bl(e)a(c)k reputation in Belgium, and de facto a French-backed Belgium energy monopolist (under the umbrella of GDF-Suez), will obtain huge amounts of feed-in incentives extracted from the purses of all Flemish people (note that end of February 2012 Electrabel also has 4,4 MWp in 15 PV-projects in their portfolio). A move that has loosened the tongues of many people there, Polder PV reported on November 26, 2010, and on December 11, 2010...
The January 2012 report also came up with another surprise: 150 MWe of capacity has been added for the category "biomass from agriculture or forestry".
Note, that in the February 1, 2012 update, a 10th "variety" has been included by VREG, biogas produced my means of "mainly" agricultural sources. This option was not present in previous reports. The same applies to an 11th "variety", introduced in the March 2, 2012 update: biogas produced from green domestic waste ("GFT") with a composting installation (1 installation, 1,4 MWel).
Flanders: distribution among PV-installations >10 kWac
One of the most interesting sections in the statistics reports by VREG is a detailed overview of the individual installations for the production of renewable electricity (for which green certificates are issued). Up till end of 2010, these data were published as - mostly - monthly pdf documents with a full list of all the installations. This list does not include the small (most PV) installations up till 10 kWac, but it gives a fascinating overview of spread in installation size and companies and a variety of institutions (and communities) involved, as well as their location (community with zip code). End of January 2011 for the first time this list was presented as an Excel file, facilitating update work. Regrettably, the publication format returned to pdf and, later, also Word documents, hampering quick analysis of changes between reports published. In particular checking out all changes in converted Word >>> Excel files is a lot of work, and has to be done with care.
Polder PV analysed the latest March 2, 2012 report (with a total of 3.382 entries on 256 pages...) in detail, extracted the relevant data for PV installations, and summarized the findings in detailed graphs below*. Update >10 kWac listing: March 2, 2012.
* Since data, in the past, have been - carefully - extracted from pdf documents, minor errors might have been included in the spreadsheets constructed by Polder PV. They will, however, have little effect on the evident trends published in the graphs published below.
(a) Accumulation of >10 kWac installation capacity and numbers
2011 - a year coming to an end
Accumulation of number of registrations and of total capacity of PV-installations (MWac) up till the last VREG report, March 2, 2012 (situation given in that report: end of February/start of March):
 |
©
Data: VREG; Graph:
© Peter J. Segaar/Polder PV,
Leiden (NL) |
Adjusted numbers
exlusive of Loghidden City
In the December 1, 2011 report, surprisingly a 23rd new large
Katoen Natie Kallo (Kieldrecht) Loghidden City sub-project ("delivered"
end of 2009) has been added (652 kWac "Ghendt Handling And Distribution
NV"). A last entry by Katoen Natie had been given in the November
2011 update for a project in the Antwerp harbour region at the Noorderlaan
directly north of the center (east-bank of Schelde), but that one, and
also 3 later projects in that area (totalling 2,2 MWac), do not belong
to the big "40 MW multi-site Katoen Natie project" that has
been in the news for a - suprisingly - relative short time.
The previous last two entries for that famous 40 MW Katoen Natie project (biggest in Benelux, largest roof-top project world-wide) were published much earlier, in the April 5, 2011 report (see special for details about that project). Average size for the >10 kWac category is now 211 kWac per installation for all accumulated entries recorded by VREG in the March 2, 2012 listing. The following basic data for the >10 kWac category exclusive of the "special" single-site Katoen Natie Loghidden City logistics complex in the western harbour area outside of Antwerp (>27,9 MWac) could be extracted from that updated listing: 3.360 installations (or: separately registered portions of large installations) with a total of 686,3 MWac and an average system size of 204,3 kWac per installation.
Big
Players and large installations registered
On top of Katoen Natie sub-projects discussed further below, several other
big projects have been included in the VREG lists in 2011 and 2012. Many
of them have already been realised in 2010.
In the January 1, 2011 report, a 1,012 MWac project bij Stas BV in Sint-Truiden was registered, and three portions of the Katoen Natie project in the Sint-Kruis-Winkel area bordering Desteldonk in the Gent sea terminal region (total of these 3: 4,755 MWac).
No further big (sub)projects appeared in the January 31, 2011 update. However, again two new projects emerged in the February 28, 2011 update. A 1,05 MWac project by Vergalle NV in the village famous for its Spring cycling classic (Ronde van Vlaanderen), Oudenaarde. And a new Seaport Terminals N.V. installation of 1,485 MWac on three warehouses at Mai Zetterlingstraat 70 in Desteldonk. Strangely, that is the same address as a previous entry of the same size under the same company name, with the same zip code, but allocated to Sint-Kruis-Winkel, at the same location just northeast of the Gent harbour region. On that same address 3 other entries of huge installations sized 1,1-2,2 MWac under daughter companies from Katoen Natie (Polymer NV, Sabeen NV) have been included by VREG (however, on other warehouses at this address). It is not yet clear if the "Seaport Terminals N.V." entries actually belong to the famous Katoen Natie project, or that it really is a separate company having done the same thing as their neighbours once they saw how lucrative the solar megabusiness was (in 2009-2010).
The April 5, 2011 report introduced 2 new Katoen Natie entries in the Desteldonk region of Gent (3,11 MWac), and 2 new installations by Invictus, one in Niel (Invictus Boom, 1,084 MWac), and one in Puurs (Invictus Puurs, 2,26 MWac). The latter project possibly has been (co-) financed by world's "most sustainable" bank, the Dutch Triodos Bank (having its roots in the antroposophic movement) via their Triodos Renewables Europe Fund in which the webmaster of Polder PV also has a small participation. The annual report 2010 of this fund claims a "Solar plant Puurs" of 2,3 MWp (apparently DC capacity reported) in its portfolio. Puurs lies just south of the river Schelde, and west of Willebroek, where sustainable bank competitor ASN Bank from the Netherlands co-financed a 2,6 MWp PV-project in conjunction with nuclear power plant co-owner Delta from the same country.
There has also been an upgrade of a WDP installation in Boom, adding almost 500 kWac to reach a total capacity of 1.911,4 kWac, while at the same time the long-time mysterious 3,6 MWac entry for Serge Hardy Lanaken (for which not one project detail has been published) has been deleted from the VREG records. It apparently never materialized, pressing further questions concerning the validity of a "VREG-registered" status of (large) PV-installations. Of course, all these tiny, but crucial details have an accumulated impact on the reliability of the PV-market statistics "extracted" from the VREG records (the only "reliable" and verbose dataset publicly available for Flanders).
The most surprising additions to the >1 MWac list however, were two entries for a Zonnecentrale Overpelt NV, 6,20 and 6,22 MWac in the April 5 update, that each outstripped the "former ground-mounted champion" Heusden-Zolder system of 4,704 MWac (Flemish province of Limburg) that received its first green certificates on December 19, 2008. Apparently there has been a mistake in the April 5 list, since the "6,20 MWac" block could not be found anymore in the May 2, 2011 update. An internet search revealed that a single block of 7,6 MWp (DC:AC ratio 1,22) is built on the premises of metal producer Nyrstar in Overpelt (see photo and info). This big PV-plant has been formally accepted by VREG on December 28, 2010, got its first green certificates on Jan. 14, 2011, and is reported to be connected directly to the high-voltage ELIA (DNB) power grid (not a surprise given the fact that Nyrstar is a metal producer using huge amounts of electricity). Overpelt is situated in the Flemish province of Limburg alongside the Zuid Willemsvaart canal in a region bordering the southern province Noord Brabant in Netherlands.
In the June 1, 2011 month report a large number of new installations were registered, including for the >10 kWac category. 8 installations bigger than 1 MWac were reported, with an accumulated AC power of 10,8 MWac. The largest has been a 1.673 kWac installation by Maasland Groefuitbating NV, SW of Opglabbeek (in Flanders province of Limburg). This company seems to be related to Group Machiels that has also been involved in several other big projects, such as the huge 7,6 MWp Nystar project in Overpelt.
The July 1, 2011 report introduced three installations in the biggest category, one with exactly 1 MWac, Orka Power NV in Bornem (SW. of Antwerp), that apparently has been rapidly sold to ING Equipment Lease Belgium NV, as this was the name of the project holder in the August 1 update for this installation, under the secondary name Orka Puurs NV. Two further >1 MWac installations were reported. One for the project developer Solarpulse III NV, 1,022 MWac in the vicinity of Bornem, Temse on the north bank of the river Schelde. And a 1,0764 MWac installation from Stas NV in Sint-Truiden, SW. of Hasselt (province of Limburg). Stas has already 5,5 MW of PV-projects in their portfolio shown in the VREG data.
The September 1, 2011 update reported a large contingency of bigger installations. Most notably, 6 installations bigger than 1 MWac were introduced: (1) 1,102 MWac Concorde NV Wervik in Houthulst (West Flanders north of Ieper), (2) 1,173 MWac Mechelse Veilingen project in Sint-Katelijne-Waver south of Antwerp, (3) 1,334 MWac Fabricom NV in Dendermonde (East Flanders), (4) 1,4904 MWac Suncop II NV in Hingene (near Puurs, SW. of Antwerp). Scaling further upwards, (5) the 4,05 MWac SPS FIN BVBA - SPS Solar Tunnel (Infrabel) project on top of the HSL high-speed train tunnel along the E16 motorway between Schoten and Brasschaat, east of Antwerp (Enfinity project with 16.000 PV-modules). And, finally (6) 4,536 MWac Zonnecentrale Tongeren NV, a huge project with PV-roofs by the famous Group Machiels that developed this massive "protection for parked new cars" on one quarter of the 142.000 m² large premises of the Hödlmayr parking in the industry park Overhaem in Tongeren (Flemish Limburg province). Installer is the famous company IZEN, who claims a yearly yield of 4.114 MWh from the 21.600 PV modules and 312 installed top-class Refusol inverters (specific yield expected: 907 kWh/kWp.year). An interesting and informative video made for IZEN can be observed on Youtube (this link).
 |
^^^ © Orka (Melle, Belgium, formerly known as Invictus). Photo from project page on website Orka |
In the October
1, 2011 listing, again a suprising 9 installations larger than
1 MWac materialised (in addition to a lot of PV-systems in the 500-1.000
MWac range). These were: 1,224 MWac Gobo Europark 27 in
Lanaken, 1,5 MWac Reynaers Alumunium (Duffel), 1,5 MWac Van Moer Group
NV (Zwijndrecht), 1,55 MWac ING Equipment Lease Belgium NV - Sun Invest
III NV (Desselgem), 1,613 MWac Karel Mintjens NV (Malle), 1,628 MWac Masabi
BVBA (Erembodegem), 2,805 MWac Bruno Invest BVBA (Munsterbilzen), and
3 MWac SOTIK BVBA in Schaffen. The largest new installation reported,
was, however, part of one of the many ING Equipment Lease Belgium NV projects.
Three different entries for that large flat roof installation are included
in this report (1x 986, and 2x 1.054 MWac), adding up to 3,094 MWac. That
is not yet the total volume realized there, since the Orka
Harelbeke NV project in the city with the same name (NE of Kortrijk,
West-Flanders), is reported to have a size of 5,004 MWp (nominal DC power,
17,871 Suntech modules of 280 Wp). officially installed on the 30th of
June, 2011. One day prior to the first law-enforced strong degression
of the value of the green certificates for solar electricity... In a personal
communication with an employee of the system builder, Dutch (Deurne, NB)
Oskomera Solar Power Solutions, I was later informed (begin November 2011)
that only 3 MWp had initially been connected to the grid. The rest is
awaiting extension of the grid capacity, which should be realised end
of 2011...
The November 1, 2011 update had less larger installations, but there were 3 PV-entries >1 MWac: (1) a somewhat surprising new Katoen Natie project, 1,02 MWac, under the "flag" Katoen Natie Bulkterminals NV, this time in the centre of Antwerpen (east-bank of river Schelde, see further below). (2) a 1,1 MWac Prosolar Invest 2 NV installation in the northern harbour area of Gent. This biggest addition sofar brings total "Prosolar" portfolio in Gent on 1,77 MWac (6 entries). Finally (3) a Dufsun PV-system with a size of 1,6274 MWac in Duffel (prov. Antwerp, along Nete Canal).
In the update of December 1, 2011, only one big installation appeared, a 2,34 MWac installation by ING Equipment Lease Belgium NV, built by Orka (former Invictus) in Eindhout (prov. Antwerp) along the Albertkanaal.
To end the year in this preliminary overview, the January 1, 2012 report came up with another spectacular 13 entries with sizes over 1 MWac (in addition to 35 new entries in the category 500-1.000 kWac, 46 new entries between 250 and 500 kWac, and 83 new entries between 100 and 250 kWac):
4
MWp PV-installation on flat roof of corrugated carton producer Soenen
in Hooglede near Roeselare (West Flanders). A project realised by
Edison Energy under the flag Ed.Proj. Epsilon NV (entry appeared
as an 3,38 MWac installation in the VREG January 1, 2012 update). Photo © Edison Energy (project page) |
 |
The first 2012 month report, the February 1, 2012 update revealed new entries > 1 MWac: 1,428 MWac PVZG_Solarrise BVBA - Associated Weavers project, which has an accompanying 924 kWac project. The 2,352 MWac project is to be found in the bilingual village of Ronse/Renaix (East Flanders). A 1,5 MWac installation by Zandvoorde Green Invest CVBA - Dumoulin is to be found in Roeselare (West Flanders); it is accompanied by a 576 kWac (roof) entry under the same project label, making it a 2,076 MWac project. Than, also in Roeselare, there is an 2,12 MWac installation by Greentile bvba - Aldi, accompanied by a 391 kWac entry, combining this to a 2,511 MWac installation. Earlier, on an Aldi premises in Erpe-Mere, a 840 kWac project was reported under the same Greentile umbrella. Finally, the biggest new installation entry in this report has been a large 2,46 MWac project with "super investor" ING Equipment Lease Belgium NV at the premises of Kuehne & Nagel in Geel (province of Antwerp).
March 2, 2012 update included several >1 MWac projects: 1,224 MWac Ecorus Invest project in Mol (eastern part of prov. Antwerp), 1,387 MWac SolarPulse VI NV in Alken (Prov. Limburg), 1,428 MWac Solarrise BVBA - Associated Weavers in Ronse/Renaix (Oost Vlaanderen), the second of a monster project already including a 924 kWac installation, hence total volume now 2,352 MWac. Furthermore, three large installations for Aldi under the Greentile project (now encompassing 5 locations with 6,6 MWac): 1,5 MWac in Heusden-Zolder (Limburg), 1,76 MWac in Zemst (Vlaams Brabant), and a 2,12 MWac installation in Roeselare (West Vlaanderen). Finally, a 1,564 MWac Futech BVBA installation in Heusden-Zolder, and two large ING Equipment Lease projects: 1,93 MWac Green-Bel - Cras in Waregem, and the biggest, ISP1-RG NV/VMW in Kluizen (ING's "ISP1-RG" portfolio now contains 10,33 MWac).
The long list shown above clearly indicates that many investors with some money to spare were very keen on realising big projects in 2011 (none has its date of approval in 2012). It remains to be seen how enthousiastic they will be in 2012, under extremely restrictive feed-in conditions and green certificates whose value has dwindled to "only" 9 Eurocents/kWh for installations >250 kWac...
The enormous Katoen Natie project remains, of course, by far the biggest - roof mounted - installation in the Benelux, see the special further below.
Special: More big players in the Flemish market A number of big players act with large, mostly roof-top PV-installations on the Flemish PV-market. With a lot of money to spend (real estate owners Katoen Natie, WDP), highly professional personnel keen on intelligent roof projects and concepts (e.g., Enfinity), long experience in the installation sector (e.g., SolarAccess, mostly working for big project developers under whose name the project is listed in the VREG records), or good contacts with financial parties, they have realized many large PV-systems in a relatively short period of time. Most of these projects will see very interesting "internal rates of return". Although with politically decided strong degression of feed-in tariffs, in particular for these large projects, the number crackers with these companies will have to redo their homework to be able to realize economically viable superprojects in the near future. Falling module prices and BOS ("balance of system") costs will certainly help to that end, but political support for solar appears to be dwindling due to one-sided "social cost" discussions. An example of companies involved has been extracted from the data available in the March 2, 2012 report. I made a selection of some of the most notable big players on the Flemish market, exclusive of the Katoen Natie super project delivered end of 2009 (38,43 MWac positively identified as such) which is considered here as a "unique case" (see special). The source data are published by VREG on a monthly basis in their >10 kWac project listing. In the table, first the main company name (sometimes appearing under a slightly different name), in the second column the number of big PV-projects sofar realised by that company (selection), and in the final column the total capacity involved in these projects (in kWac accumulation). This table (extract) adds up to 284 MWac, which represented over 18% of total VREG-registered market volume in Flanders, March 2, 2012 (1.549 MWac). Mostly projects of hundreds of kWac or even over 1 MWac are included here. The listing is not exhaustive and known newer projects are not yet included.
The table lists a variety of companies, ranging from an energy utility deeply involved in huge amounts of fossil and nuclear power (Electrabel, actually Belgium's super monopolist under major French stake-holder Suez), PV-specialist companies like Enfinity (famous for its fast rise, and active in many countries including China), Belfuture, and Zonnecentrale. But also big retailers like Colruyt, Ikea, and, more recently, Aldi, are highly active, and, as an example of further potential, at a very benign level realizing smaller projects on schools etc., several Flemish communities ("Gemeentes & Steden div."). Another "very special case", marked in red, is the bank consortium ING (originating in the Netherlands) that has realised - or aggressively acquired in the course of time (in particular during the second half of 2011) - a staggering volume of 77,9 MWac in 195 entries distributed among app. 128 projects and -portfolio's (that used to be only 34 MWac in the Dec. 1, 2011 report!), almost all via their Equipment Lease branche in Belgium. More projects will most probably follow in later updates, it seems that ING has become a "wholesaler" of big photovoltaic projects in Belgium. GFS Veurne is one of the few "big" free-field installations in Flanders (southwestern part of Belgium, close to the French border). It has been realised by Netherlands (Venlo) based Scheuten Solar (filed for insolvency in March 2012), together with Flemish project developer Green Fever, and the installation has a size of 2,7 MWp (DC capacity, represented by 2,58 MWac in the VREG records, in two different segments). The "Zonnecentrale" company is also very interesting. Only 8 installations have a total capacity of 21,0 MWac, a spectacular system average of 2.627 kWac per installation. The biggest one at that time is Overpelt 6,22 MWac. The other projects can be found in Beringen, Genk, Hasselt, Heusden-Zolder, Lommel and Maasmechelen (system sizes between 429 and 4.704 kWac). Later, the 4,5 MWac project in Tongeren has been added to their spectacular portfolio. Another striking player shown in this table is a big real property company (in Flemish: "vastgoedbevak"), the stock-exchange-quoted Warehouses De Pauw (WDP). It is represented with 12,4 MWac of large projects in the March 2, 2012 VREG listing, and the company is planning a volume of approximately 30 MW of renewable capacity [including windpower] on or nearby its own warehouses and other property to be able to exploit their business on a "CO2-neutral" basis at the end of "Kyoto" year 2012. In a press release dated April 28, 2010, the company announced it already had 10 MW of PV projects realised in 2007-2009, and that it was planning another 8 MW in a new phase that should end in the first half year of 2011. Hence, possibly more of their projects will materialise in coming VREG updates. Already 10 percent of the company's income (5 million Euro/year) is said to originate from the feed-in tariffs earned by these big PV-projects in a news item of August 25, 2010 (and others). Many people in Flanders think that is not the way things should go in Belgium. Because all electricity consumers pay a rate on top of their kWh tariff from which the green certificates are financed by the net managers. Including those for huge projects such as parties like WDP have realised or will build in the near future... |
(b) New installation capacity per month or in the VREG reporting period
An example of the new capacity per category is given below for the busy month, May 2011.
 |
©
Data: VREG; Graph:
© Peter J. Segaar/Polder PV,
Leiden (NL) |
(c) New installation capacity per day in a specific VREG reporting period
In the final graph of this section the per day graph for the last period reviewed by VREG is shown. The graph shows the data for February 2012 (29 days):
 |
©
Data: VREG; Graph:
© Peter J. Segaar/Polder PV,
Leiden (NL) |
Graph legend b and c: grid connected systems >10 kWac only; light green = number of new registrations (left Y-axis); light orange = new added capacity (MWac or kWac) in the period under consideration, per category. Graph (b) shows the total capacity and/or number of registrations in the given example. Graph (c) gives the capacity and/or number of installations per day in the last month, as calculated from the data reported by VREG.
In the last graph it becomes clear that in February 2012 again a considerable volume of new capacity has entered the VREG database, in particular for the larger installation sizes > 100 kWac. Due to some very big new installations, the market segment >1.000 kWac has been popular, 485 kWac on average reported per day in that month.
For the reported multisite project Katoen Natie 40 MW on 4 locations in Flanders, parts of which for the first time were incorporated into the VREG statistics in the July 2010 update, new portions were added in later updates, starting with August 2010. This huge project (cost: € 166 million), partly financed by loans from Dexia Bank and another, unnamed bank, is cut into a lot of smaller pieces between 0,21 and 2,22 MWac under various (new) company names. Most probably for financial reasons (optimal taxation issues related to the green certificates earned?). Up till the October 2010 update, only one installation was mentioned under the identifiable name "Katoen Natie Terminals NV", a second segment under that name followed in the November 2010 update, but all the other projects have been filed under different sub-company names (and in a later stadium designated as such by VREG in their installation records).
Two new entries appeared in the Jan. 1, 2011 update, under the location Sint-Kruis-Winkel (together 3,27 MWac), for Katoen Natie daughters Polymer NV and Sabeen NV. These are at the same installation location address for which already a "Desteldonk" entry was known, accumulating to 4,95 MWac for these 3 subprojects in the sea harbour region of northern Gent. In addition, a fourth entry was filed under the name Seaport Terminals NV (1,485 MWac) on that date, with Sint-Kruis-Winkel as location, and a fifth entry under the same name and with identical size in the Feb. 28, 2011 report, again with Desteldonk as location (all: same zip-code and same address...). The latter two are on exactly the same address, on different logistics halls (numbers 17-19 and 19-21; the three Katoen Natie entries here have been realized on halls 14-16, 26-30 and 36-39), but it could not yet be established if Seaport Terminals N.V. is a daughter company of Katoen Natie or not (VREG does not give a positive clue in this direction). As for now, the Seaport Terminals entries are not considered as part of the "Katoen Natie" super project.
Also note that one of the smaller (246,3 kWac) "Kallo (Kieldrecht)" segments has been earmarked with an address that is on the eastern side of the Vrasene Dock, more to the southwest of the Loghidden City complex (Land van Waaslaan Haven 1168/Saeftinghe Loods 5). So actually this is a separate location. Still no "hits" appear to have been included for the so-called Euroterminal of Katoen Natie to the southwest of that separate Vrasene Dock, that has once been said to be part of the whole 40 MW project.
Surprisingly, another sub-installation on the Kallo (Kieldrecht) Loghidden City terminal has been added in the VREG list of December 1, 2011 (652 kWac). That VREG report now lists 22 portions (27,92 MWac) for the Kallo-Kieldrecht location on the Schelde West-Bank (not on Antwerp soil, but nearby on the premises of the province of East-Flanders). In addition to this, now at least 5 portions for the Katoen Natie logistics terminal in the Desteldonk/Sint-Kruis-Winkel area have been identified by VREG as belonging to the Katoen Natie project in the harbour region northeast of Gent (also on soil of East Flanders; 8,12 MWac). The relation of the 2 Seaport Terminals entries in that area with the Katoen Natie project is not certain (therefore not included). Finally, 2 installations in the Katoen Natie terminal area of Genk in the Flemish province of Limburg in the northeastern part of Belgium are also reported with a total size of 2,15 MWac under the prozaic (and confusing) company name "Ghendt Handling And Distribution NV" (which has its main office in Desteldonk/Gent...).
Taking all together, a total capacity of 38,43 MWac for the multisite Katoen Natie project has now been registered with VREG and positively identified as such belonging to that project. Note that this volume (possibly 42,3 MWp?? if DC:AC ratio of the installations would be 1,1) might lie even beyond the 40 MW announced as early as end of 2009. If this is true, it seems that the whole superproject now finally has been included in the VREG database.
Trina Solar, the Chinese module producer, claimed to have delivered to system builder Invictus approximately 180.000 modules, types TSM-PC05 220W and TSM-PC05 230W for the whole project (this document, that wrongly suggests that all the modules would only have gone to the Antwerp region). If half of both types would be used for a tongue-in-cheek calculation, this would mean on average 180.000 x 0,225 = 40.500 kW. The "40 MW" often quoted apparently must be the actual nominal DC generator capacity. Hence, most probably 40 MWp. If the 38,43 MWac mentioned above turns out to be the "definitive" capacity registered with VREG, the ratio DC power to (max.) AC inverter power appears to be 1,05:1. A frequently mentioned ratio [10% more DC power than AC power] is 1,1:1).
From the data so far extracted from the VREG records, it is crystal clear that the Kallo-Kieldrecht location, named "Loghidden City" by Katoen Natie has, with its 22 portions now registered by VREG, 27,92 MWac of capacity. Since the VREG report for July 2010 it already is officially the largest realized "single site" (but multi-roof) PV project in the Benelux, with decreasing possibility that more volume will be added in coming VREG reports. Note that Katoen Natie's Euroterminal, also in the West-Bank area of Antwerp's huge harbour region extending into East-Flanders, has not been specifically mentioned by VREG.
Not
belonging to "Katoen Natie"? Sofar, no distinct connection of this company (G.W.S.) has been found in relation to the Katoen Natie holding, despite the fact that several K.N. entries have a somewhat reminiscent daughter company name ("Ghendt Handling And Distribution NV", 2 of them in Genk, and one single site just southwest of Katoen Natie's "Loghidden City" on the Schelde West-Bank). Also, the two "Seaport Terminals N.V." entries with a total of 2,79 MWac on neigbouring warehouses at the Mai Zetterlingstraat 70 in the Desteldonk (= Sint-Kruis-Winkel) area in the harbour region of Gent are not included here under the Katoen Natie umbrella. Activities of all of these companies clearly are focussed on large-scale warehousing services - in exactly the same harbour areas as the "true Katoen Natie" entries. |
More appetite
for Big Solar
Surprisingly, long after the April 5, 2011 report by VREG, in
the November 1, 2011 update a new entry sized 1,02 MWac was published
under the flag "Katoen Natie Bulkterminals NV, Noorderlaan 399".
However, although it clearly is a new installation of the Katoen Natie
holding, this specific PV-system is not part of the huge
project mentioned above, since it is Katoen Natie's first (identifiable)
installation on soil of Antwerp itself, on the east-bank of the Schelde.
Apparently the management has a good appetite for solar installations
on their huge warehouse roofs spread among many locations, since their
original super project went on-line.
In the January 1, 2012 update, three additional "Katoen Natie" entries in Antwerp have been incorporated in the VREG listing. They represent two different locations, with a total installed power of 2,277 MWac. Two of those entries, Werf En Vlasnatie NV (Katoennatie), were "fused" under a single entity in the February 1, 2012 report.
Note that, because of the different locations of all these Katoen Natie PV-installations, the management of this large logistics company has to deal with at least 4 different net managers: Intergem for the Loghidden City terminal, Imewo for the Gent / Desteldonk / Sint-Kruis-Winkel segments, Inter-Energa for the two installations in Genk. And, finally, IVEG for the new entries on Antwerp soil (included in the November 1, 2011, and January 1, 2012 reports). It is expected that a lot of paperwork has been generated because of the complex segmentation of larger installations, and the mostly troublesome dealings with Flemish net managers that have many problems with rather antique infrastructure.
Katoen Natie
line-up
One
of the interesting new data since publication of the Jan. 31, 2011 Excel
spreadsheet on the VREG website is the fact that per installation the
official installation date is show, as well as the date on which the first
green certificates have been awarded to the project (actually the final
step in the whole "official procedure" for PV with the VREG
administration). With these data it could be shown that for the now known
30 installations for the Katoen Natie super project, a time span of less
than 4 months lapsed between the official installation dates for the first
(Sep. 4, 2009), and the last sections identified (8 sections on Dec. 31,
2009). But that over 14 months have lapsed between the dates on which
the first green certificates issued for the first (Sep. 3, 2009) and previous
final two sections (November 16, 2010) incorporated in the April 5, 2011
VREG update. I summarised the findings in the following 2 new graphs.
 |
^^^ See next graph for the dates on which first green certificates were issued for the separate sub-installations of Katoen Natie (4 different locations) by VREG. Graph updated with December 1, 2011 report (one new entry). |
 |
^^^ Indicated in numbers in the graph are either the capacities of single sub-projects per issue date, or the accumulation of the capacities if different sub-projects were issued on the same date (per location). The total of sub-projects positively identified as belonging to Katoen Natie amounted to 30, 22 of them for Loghidden City (and a separate small sub-project lying very close in the Waasland Haven). Total capacities identified for the three main locations are indicated in the legend. The red line indicates the start of the new incentive scheme beyond the "transition period" allowed by the Flemish authorities. If installations had the modules in place end of December 2009 (with report of preliminary approval), and were able to have the PV-system completed with inverters end of February 2010, they would be eligible for 45 Eurocents/kWh feed-in tariff for 20 years. If that dead-line had not been realized in time, the installation will only fetch 35 Eurocents/kWh for 20 years (if installed completely in 2010). Also all other installations not having the modules in place end of 2009, and newly realized in 2010, will get that much lower (but still highly interesting) premium. As per January 2011 new degressions have been decided, starting with 33 Eurocent/kWh on that date (no transition period). These considerations do not apply to the Katoen Natie project, since all sub-installations apparently have passed the "transition period" without problems, and can apply for 45 Eurocent/kWh for 20 years. Katoen Natie had also a new project registered on the East Bank of the river Schelde (Nov. 1, 2011), a 1,02 MWac project in the central harbour of Antwerp (not included here). There are also other bigger projects in the Gent harbour region, with company names very similar to some of those used for the Katoen Natie super project. However, as of now the companies mentioned have not been positively identified as belonging to the Katoen Natie holding. Note that the time-scale in this graph is different from that used in the previous graph for the "Date of official installation". |
Five installations have been registered as such in the Desteldonk / Sint-Kruis-Winkel / Gent region (e.g., Mai Zetterlingstraat 70, see photo of the complex on the Katoen Natie website), as well as two on the Katoen Natie logistics terminal in the industrial area bordering the Albert Kanaal south of Genk in the Flemish province of Limburg. On the latter complex, 2,15 MWac has been registered in 2 segments for the company Ghendt Handling and Distribution N.V. This website shows that this company also is part of the large Katoen Natie holding. The 40 MW project was "claimed" as such at the end of 2009 by the principles of Katoen Natie in a few short press communications and television broadcasts. It still is not definitively clear if the "40 MW" claimed refers to AC capacity, or possibly to the MWp nominal capacity of the PV-modules involved (source: Trina Solar, China). See also the photograph below.
Photo
© 2010 DigitalGlobe, Geo Eye, Aerodata International Surveys / Google
Maps project (this
location).
See also below for link to more recent, spectacular photo's on Bing Maps!
Photo 1 - The first Katoen Natie terminal buildings filled with Trina Solar modules were appearing in Google Maps satellite photo's midway 2010, such as the one above. Three halls had been completed already at the time that this photo was taken. It shows the southwestern part of the huge "Loghidden City" complex in the Kallo/Kieldrecht harbour region northwest of Antwerp on East-Flanders province soil (Schelde West Bank). Other halls appeared to have already mounting frames in some areas, but most halls did not show any roof-related activity yet. However, a company video published later by installer Invictus shows that at least this "Loghidden City" complex is mostly filled with crystalline PV-modules.
Note the lorries on the photo to get an impression of the enormous scale of this logistics complex. It is also evident from the satellite pictures that the halls, and also the modules themselves are oriented in arrays slightly south from SW. This has only slight impact on physical production, not deviating much from a pure south orientation. The project as a whole (at least three different locations) should produce in the order of 35 GWh/year according to press releases. This could indicate an expected specific production of only 875 kWh/kWac.year. This might be a rather conservative estimate.
The first partial projects of this site ("Kallo/Kieldrecht" location) have been reported by VREG in the August 1, 2010 report (8 segments on this location and one in Gent/Desteldonk, total of these: 15,37 MWac); more sections followed in later VREG reports.
New photo's with (almost) full PV-project portfolio of Katoen Natie! (added November 25, 2011)
Bing Maps has very nice and sharp new satellite photo's of the Loghidden-City Terminal project on the Schelde West-Bank: here!
And also of the Euroterminal area further west in the Waasland Haven area: here!
And also on the Gent harbour area projects in Desteldonk / Sint-Kruis-Winkel (note also other logistics firm entries in VREG database not yet conclusively connected with the Katoen Natie holding have been realised in this area!). Just zoom in and wander around...: here!
And on this aerial view you can visit the two Katoen Natie entries in the industry area of Genk in the Flanders province Limburg, far away from the previous two locations...: here!
Flanders:
distribution among PV-installations < 10 kWac
Installaties kleiner of gelijk dan 10 kWac in Vlaanderen: verdeling
Once the number and capacity of the accumulated >10 kWac installations is known from the separate list for that category (previous paragraph), it is easy to obtain the data for the smaller PV-systems in Flanders since VREG also publishes a list ("Productie-installaties waarvoor groenestroomcertificaten worden toegekend") with accumulations of the capacities and numbers for all renewable electricity generating installations. By subtracting the volumes for the >10 kWac category PV-systems from the accumulation given in that list for all (PV-)installations in the same period, the data for the remaining < 10 kWac installations can be calculated. This results in the two following graphs. First total volumes and their distribution are shown for photovoltaics.
Note that, as of December 2011, I have included a new installation size segment >250 up till 500 kWac. This is the result of the fact that VREG has started an overall overview of realised capacities (separately published Excel file), in which they discriminate between installations up till 250 kW[ac], and larger installations.
Relative
contributions of market segments in photovoltaics Flanders
In this graph in the left "100 percent column" the share of
the categories discriminated by me (all installations up till 10 kWac,
and 8 subcategories larger than 10 kWac) is shown for the numbers of installations
(for the largest systems sometimes separate entries of fragments, such
as Katoen Natie's Loghidden City: one complex, 22 entries). 100% is 180.092
installations (March 2, 2012 report). From that column it is crystal clear
that the <10 kWac segment of the market is the unparallelled
contributor, with 98,1% of all PV-installations (or segments) installed.
A very different outcome shows up when the installed capacity is taken as the discriminating value, as depicted in the right "100 percent column" with stacked categories ("MWac"). In that column stack, 100% is 1.549,4 MWac. Here, the <10 kWac segment only claims 53,9% of accumulated installed (AC) capacity, and 46,1% is claimed by installations each having a capacity larger than 10 kWac. Of those, the biggest "total capacity contributor" is the >1.000 kWac segment with 11,8% of accumulated photovoltaic AC capacity. The next three segments have comparable shares: 9,6% (>500 - 1.000 kWac), 10,0% (>250 - 500 kWac), and 8,7% (>100 - 250 kWac). The contribution of the market segments >10 up till 100 kWac is much smaller (>50 up till 100 kWac: 4,0%) to negligible.
Note that VREG does not further discriminate any subcategories in the "small" market segment up till 10 kWac. Hence, no further "split" can be made in the white column parts in this graph.
Relative
contributions of PV-systems in the >10 kWac category
In
the largest market segment >10 kWac, I also distinguish between subcategories,
and the contribution of those in the installed volume for only that market
segment (hence: not for all PV-installations) has been visualized in the
next graph (note again that subcategory >100 - 500 kWac has been split
in two different categories, >100 - 250, and >250 - 500 kWac as
of the December 1, 2011 update on Polder PV).
The same scheme is applied here as in the previous graph. For "100 percent" now the accumulated volume for only the >10 kWac market segment is used (number of installations and inverter capacity, respectively).
In the left column, shares of the 8 subcategories now discriminated by me have been shown with respect to the number of installations (or installation segments separately registered by VREG). 100% is here 3.382 registered entries (sometimes representing portions of bigger installations). The stacked column shows dominance of the >50 up till 100 kWac subcategory (25,0%), closely followed by the >100 up till 250 kWac subcategory (23,9%). Shares are relatively well spread among subcategories, however with minor contributions of the the 2 largest subcategories, and the smallest >10-15 kWac market segment in this overview.
Since VREG has started a new list with distribution among gross system sizes of up till 10 kWac, >10 up till 250 kWac, and systems > 250 kWac, I included the percentages for the latter two "VREG categories" in the market for large PV-installations >10 kWac: 78,2% of the >10 kWac market is in the range >10 up till 250 kWac, and the remaining 21,8% is made up of larger PV-systems, if one considers number of installations.
In the right column, again accumulated capacity (MWac) for each subcategory is the discriminating feature in relation to accumulated installed capacity for the >10 kWac market segment. 100% for this column stack is 714,2 MWac. Here a slightly different picture emerges as with number of installations. The biggest category > 1.000 kWac leads with an accumulated capacity of 25,6% of the >10 kWac market, followed by 21,6% for the > 250 - 500 kWac segment, and 20,7 and 18,8% for the segments > 500 - 1.000 kWac, and > 100 - 250 kWac, respectively. The top 3 subcategories (>250 kWac per installation) together make up 67,8% of total installed/registered capacity in the >10 kWac market segment*, the rest (32,1% of capacity) is distributed among the lower size categories. For comparison, please note that installations >100 kWp were not allowed under the highly restrictive SDE "incentive" regime in the bordering Netherlands up till 2010. Besides: for the exceptionally unattractive SDE 2011 regime, only few plans for installations larger than 150 kWp have been given green light for an uncertain realisation traject with subsidy that amounts only 3,5 Eurocent/kWh in 2012 on top of net metering (if possible)...
* The high volume claimed for he biggest installation categories has been putting extra pressure on Flemish authorities to decrease incentives, since only the larger companies are able to buy these sizeable systems, while the citizens will be confronted with higher electricity prices to pay for all the solar (and other "renewable") kWh's fed into the grid...
Average of newly registered installations per day
The listings for all new PV-installations (accumulation of numbers and nominal capacity only), and the one for the individual >10 kWac PV-systems are published separately by VREG. The publication date of these updates has been slightly different for some months in earlier reports: hence, the span of time covered by each report can differ slightly from a period of one month. To be able to compare the progress in new installations on a daily basis for the category larger than 10 kWac as well as that for the smaller PV-systems (max. 10 kWac), separate calculations have been carried out by Polder PV for the average daily newly reported capacity, as well as for that of the >10 kWac systems. Average daily progress in new VREG registrations has been calculated by dividing the growth in the monthly report under consideration by the exact number of days spanned by that report. Furthermore, to obtain the daily average for the <10 kWac pool, the calculated values were subtracted (total average minus average for >10 kWac group).
With these results, I was able to produce the following graphs, showing the considerable fluctuation in daily average level of registration on a monthly basis for both groups considered. Note that in later month reports a considerable volume of extra reported installations will have been allocated to previous months (or even years). Hence, actual monthly growth is considerably different from the report actualisations shown here (for actual designation to month of official installation, see special on official entry date. The graph below, therefore, shows only the trend of the VREG reporting on an average daily basis.
^^^
Stacked
graph
Results for
both groups (up till 10 kWac, and >10 kWac) stacked to show average
daily progress in new registrations as published by VREG in the periods
designated on the X-axis. Note that these periods need not represent exact
monthly periods. For example, there were no separate reports for March
and April 2010, so the average daily growth for both months together has
been calculated. Not all months are fully covered in one report. Therefore,
the result for that month has been calculated from the span within that
month as indicated by the dates of publication indicated by VREG. Examples
are June (1-29) 2010, and October (1-28) 2010. Note that the daily average
for new registrations in the category >10 kWac installations (green
column segments in this graph) fluctuates considerably through the months
of the year, in between 35 and 2.716 kWac on average per day up till Dec.
2011 (difference maximum factor 78). Which can be attributed only partly
by the inclusion of very large installations > 1 MWac in a certain
period of time.
Trends
installations >10 kWac
It is expected that long validation and registration times might also
play an important role in the uneven distribution of the large installations
in the VREG registration statistics. For example, the 40 MW Katoen Natie
project, already reported as "installed" end of 2009, has taken
a long time for (expected) final disclosure within the VREG database (see
graphs in the Katoen Natie special, a 30th
sub-installation was added as late as in the December 1, 2011 report).
Another example: The 1,87 MWp amorphous silicon thin-film project on the
Flanders Expo near Gent, already reported
by me at the start of December 2009, only has reached the VREG listing
in the April 5, 2011 report (in 5 separate entries with 1,596 MWac, hence
DC/AC ratio of 1,17).
Finally, in the December 1, 2011 report, 5 sections of the Balta (ITC) PV-project with an accumulation of 2.969 kWac in Tielt have been published by VREG, under the (new) project owner name Eneco Solar Vlaanderen (the third big utility company in Netherlands that is unable to score such projects in our country because of deplorable market conditions for big-size PV). That specific Balta project was already officially accepted by VREG on the final day of 2010, December 31rd. These examples show that there can be a (very) long time between actual project realisation and official VREG registration.
Grid-connection
delays
Another aspect that should be taken into consideration is the actual grid-connection.
Belgium has a lot of problems with old electrical infrastructure, and
connecting big new photovoltaic installations to the grid often encounters
several problems, strongly depending on the grid region. For example,
it seems to be problematic to connect large systems in the coastal region
of Flanders, since the net capacity has been claimed to a large extent
for the off-shore windpower capacity already approved. The 5 MWp project
Orka installation in Harelbeke (West Flanders, listed in the VREG database
as an ING Equipment Lease project in 5 entries) mentioned elsewhere on
this page (photo) initially was only partially
connected to the grid. Only if the remaining portion is connected, that
part of the installation is given the "green light" by VREG,
and an entry for that section might be expected in the published VREG
records (pers. comm. with Oskomera, the project builder). Up till the
March 2, 2012 report 4,4 MWac of the capacity had been claimed (date of
approval June 30, 2011, first green certificates produced July 1, 2011).
With reference to the image presented above, an "all-time-low" was initially reported in the >10 kWac VREG registrations for January 2011, only 47 kWac added per day in that month for the "big" category. It was however later underscored by the even lower volume of only 35 kWac/day in the holiday month July for the big installations. On the other hand, May 2011 initially revealed a new record volume of 1.785 kWac for this category. That was surpassed by an end-of-year rallye, with a spectacular volume of 2.716 kWac in the January 1, 2012 report. The massive rise of registered installations in the post-vacation August (1.330 kWac/day) and September updates (1.674 kWac/day) is probably the result of projects finished earlier in the year, most likely just prior to the strong degression implemented on July 1, 2011. It remains to be seen if there still will be room for new big PV-projects, as the next degressions (October 1, 2011 and, in particular, January 1, 2012) have already been implemented for these capital-intensive installations, and green certificate value has dwindled to only 9 Eurocents/kWh as of the beginning of 2012. If module prices keep dropping as they have done so in a spectacular manner since 2010, the appetite for such projects might lead to another "now or never" boom before the next degression for the value of green certificates in the new year. However, if banks will further pull the leads on conditions for loans for such projects in times of increased financial crisis, that positive trend might have already been stalled or seriously influenced in a negative manner. In the March 2, 2012 report, with February data, still a considerable volume of 1,8 MWac/day has been registered, but these concern projects planned - and realized - long ago.
Trends
installations up till 10 kWac
The smaller market segment of <10 kWac (blue
column segments in this graph) showed a more stable development up till
the spring of 2011. Ranging between 316 in March/April 2010 up to a notable
end-of-year mini-rush of 816 kWac in December of that year, on average
per day (factor 2,6 difference). Note that, while January 2011 has been
a dramatic month for development of the market registration for installations
>10 kWac, the registrations for smaller PV-systems appeared to be unaffected,
with a healthy 482 kWac of new installations on average per day. February
up till April 2011 continued that healthy trend with almost 600 kWac of
new VREG registrations on average each day. As of May 2011, growth for
this smaller category has even been spectacular, almost tripling new volumes
on average per day in 8 months on a row.
This strong increase for the small category might be the result of a combination of the ever decreasing module prices in the minds of ever more well-informed Flemish citizens, and a shift in attention by system planners to the smaller markets, that still have lucrative net metering in addition to the green certificates issued by the regional net managers. The extra, lucrative tax breaks, have now finally been omitted by the Flemish government as of January 1, 2012, which the sector thinks will break down market growth. The effects might, however, be much less dramatic as the sector seems to suggest.
A new record volume of 1.513 kWac a day for the small category in June 2011 has now been slightly surpassed in January 2012 (1.526 kWac/day). However, total additions in that month were no match for the final report for the previous year. December 2011 has, up till now, been the total average/day capacity breaker, in particular due to the record volume for the >10 kWac installations. With an impressive 4 MWac for total volume on average on a single average day, December 2011 showed 30% stronger growth than the previous, short-lived September record month...
Graph
aligned + trends
In the next graph the results for both market segments
are shown adjacent to each other:
For both categories also (Excel-generated) linear trend lines have been incorporated in the graph. For the period shown in previous graphs for 2010, there has been a conspicuous general downgoing trend for the daily average new capacity registered for installations >10 kWac by VREG (green dashed trend line). Due to the strong growth of newly reported big installations in most VREG issues published as of May 2011, the trend line has, however, turned into a positive direction again. Although the dramatic outcome for the holiday month July 2011 has been the ultimate negative trend-breaker, that was surpassed again with massive new capacities in the 2 following month reports, and November, with another phenomenal record volume in the December report.
A very clear general upward trend remains apparent for the PV-systems with a maximum size of 10 kWac in the VREG registrations, that even has increased strong momentum later in the year (blue dashed trend line). One should be cautious to interpret these as "the real market trends", in particular for the larger installations that apparently take a long time to materialise in the VREG statistics ("officially registered") after submission of the projects. For the small category up till 10 kWac, VREG stated in their 2010 year report on green electricity (published August 5, 2011), that 69% of the on-line requests for photovoltaic installations got immediate approval within 24 hours after submitting the digital paperwork resulting from automatic controls of the data provided. A minority of the submitted small projects takes a longer time to process, including the approximately 8,3% of total projects submitted to VREG for the small category that has been sent physically (on paper) by post in 2010.
Predictions as to how the two market segments will evolve are hard to make, and will be highly effected by the degression steps in the feed-in categories decided upon by the Flemish authorities, in combination with the positive trend of ever-decreasing module prices. Another critical factor will be the "perception" with the Flemish inhabitants, as publications related to solar development, costs, and benefits, appear more frequently in the newspapers, magazines, radio, TV and, of course, on the internet. Of course, another subjective influence might be the uncertainties in the EU concerning the general status of the global economy. Finally, in particular the delay in registration of the larger PV-projects in the VREG records, sometimes long after installations have been connected to the grid is a factor making interpretations of "real" market development in Flanders a difficult task. This, however, is not unique for Flanders (it can be far worse, like Italy has shown with their bizarre - explosive - market development that is very hard to keep track of).
Detailed
graph for segment >10 kWac
With respect to the market segment of >10 kWac installations,
for which individual system size details are available in a long list
on the VREG website, a more detailed daily average graph has been made
of older data, showing the dynamics up till April 2011:
Detailed split of the (original) 7 capacity categories discerned by Polder PV to show development in average daily new registrations in the periods shown on the X-axis (month reports by VREG). In particular the larger categories >100 kWac fluctuate considerably in the course of time. If this is "true installation reality", or that it might be a flaw of the administrative delays in the registration system with VREG, or perhaps both, remains unclear. The peak in the period June 29 up till August 1 ("July") for the largest category >1 MWac (green curve) could be attributed to the first 9 sub-installations of the Katoen Natie super project being registered by VREG, resulting in a "month-average" of 792 kWac newly installed capacity for that category per day.
Note that in the Dec. 1, 2010 report, an installation of 12 kWac in the small market segment of installations up till 15 kWac has been removed in the VREG update, which resulted in a slight "negative growth" for the last month in this graph (not discernable at this detail level). In the April 5, 2011 report 7 smaller installations in the >10 kWac category (10-15 kWac), and the 3,6 MWac Serge Hardy project have been removed for unknown reasons. Sometimes upgrades (capacity) and renewals of previously registered installations occur in several VREG month reports, but in general they have only minor influence on general "growth" trends such as depicted in the graphs in this section.
The graph shows very clearly the considerable negative impact on the registered market growth in all segments >10 kWac at the start of the new year (2011). Growth in registrations had almost come to a stand-still in January 2011. As of February 2011 however, growth in this market segment has regained positive momentum again.
This graph is not being updated anymore.
Calculation
of the impact of the market segment of maximum 10 kWac
When subtracting the capacity of 714,2 MWac for the >10 kWac
installations (graphs above) from the reported total of 1.549,4 MWac in
the separate installation listing in the VREG March 2, 2012 update, a
volume of 835,1 MWac remains for the "maximum 10 kWac" installations
market segment.
With (few) installations removed from earlier VREG lists taken into account, the number of installations >10 kWac turned out to have grown to 3.382 in the March 2, 2012 report (average size for that category: 211,2 kWac/installation). VREG reported in the same month a total accumulation of 180.092 registered PV-installations (report date-stamped March 2, 2012). Hence, 176.710 systems (or, preferrably: "registrations") should be allocated to the category of max. 10 kWac installations.
Taking these two data together, 176.710 smaller (mostly but not exclusively: private households) "installations" with a total capacity of 835,1 MWac (53,9% of the Flemish market with respect to capacity installed) would have an average system size of 4,73 kWac. If DC:AC ratio is taken with a factor 1,1, this would mean that average small nominal DC power for those "small" installations would amount to approximately 5,20 kWp. If the basic data for this calculation are considered correct.
Additions to the >10 kWac list - status March 2, 2012
As of the beginning of 2009 I planned to screen the intriguing listing of >10 kWac Flemish installations (revised pdf with 204 pages for the December 1, 2011 update). In the graphs above I have visualized the changes for this category. In this section I will emphasize some of the most important changes and additions to that list. See also the big installations update earlier on this web page.
Photo © JUMA Beton NV- IZ Maatheide, Maatheide 105, 3920 LOMMEL, Belgium (photo from this web page)
Photo 2 - Lots of inverters (72, to be precisely), for a large 770 kWp PV-installation with multicrystalline Scheuten Solar modules in Lommel. Added to the VREG inventory in the February 2010 listing, although only 730 kWac was specified there, a generator [DC]/[AC] inverter ratio of 105%. 3.942 [195 Wp] multicrystalline modules on the 17.500 m² industrial roof of Juma Beton NV (Valeres building group, see also their news item, and the Global Solar Technology article, July 23, 2009). The installation, delivered in October 2009, has been realized by the Dutch system house Scheuten Solar (see project page), in conjunction with the engineering bureau 3E. For more photo's see this link on the Juma Beton site.
New (and sometimes removed) installations (March 2, 2012) since the VREG report published February 1, 2012. Discrimination in - now 8 - classes defined by Polder PV. Installations added to the VREG list in 29 days time, many of them formally installed in 2011 [77% of total capacity added], some in 2010 [almost 11%] or even in 2009, almost 0,4%. And, with new additions of over 12% for new installations in 2012. Details published by VREG for >10 kWac installations only.
Special: Distribution of PV-installations among net managers involved
Another interesting new issue published in the first Excel spreadsheet by VREG (original Jan. 2011) has been the net manager region in which the solar electricity is being produced for the installation category >10 kWac. This feature had not been published earlier. From the March 2, 2012 status report (Word file exported to Excel), I extracted the following graph to give a general view of distribution among net managers in Flanders.
Situation as of March 1, 2012. Total number of installations >10 kWac: 3.382, with 714,2 MWac in accumulation. Note that the X-axis are in logarithmic scale, to accomodate the accumulation for all VREG registrations at the bottom-line (in deviating colours). Yellow bars are total number of installations, with the actual number in black at the left (scale: bottom X-axis). In dark orange bars accumulated capacity in the net manager region has been added, with the actual data at the right end of the bars, in kWac (scale: upper X-axis). The net managers with most >10 kWac installations at that time were Inter-Energa (785, 23,2%), Gaselwest (702, 20,8%), and Iveka (470, 13,9%), respectively. With respect to total installed capacity, however, the order is Inter-Energa (151,3 MWac, 21,2%), Gaselwest (141,8 MWac, 19,9%), followed by Iveka, Intergem and Imewo close together (having 83,7 MWac, 11,7%, 77,4 MWac, 10,8%, and 76,8 MWac, 10,8%, respectively). Both Inter-Energa and Gaselwest already have far more photovoltaic capacity (note: AC value) in their Flemish net region as the whole of the country Netherlands has probably accumulated in 2011.
Note that in the Jan. 1, 2012 report, a new net manager was temporarily added, BIAC/DNBBA, that regulates the net of Belgium's Nationial Airport NE of Zaventem. It had been incorporated because of the new VREG entry on the premises of Brucargo on the premises of the airport. However, that 1,66 MWac installation now is found under the umbrella of the high voltage network manager Elia (DNB). On the other hand, in the Feb. 1, 2012 report, the small company AGEM (the last autonomous distribution net manager in the hands of community Merksplas) has been deleted as identity from the VREG records. Its services have been taken over by Iverlek as per Jan. 1, 2012, which itself has outsourced most of its net manager functions to the umbrella organisation Infrax, (see message on the website of Merksplas community).
Still another picture emerges if the average installation capacity of these >10 kWac PV-installations is calculated per net manager region. In that case, the high-voltage net manager Elia (DNB) daughter easily wins the race with 1.875 kWac per installation (only 11 of them). Included in their (small) portfolio are the already mentioned Zaventem Burcargo project (1.660 kWac), the large 2.670 and 6.220 kWac Zonnecentrale installations in Lommel and in Overpelt, and the 4.050 kWac "Solar Tunnel" near Schoten/Brasschaat, and [in]directly connected to Elia's high-voltage network.
Second after Elia is net manager Sibelgas with 328 kWac on average per installation (only 23 PV systems >10 kWac, 12 of them (much) larger than 300 kWac, the biggest one being a 1 MWac PV-plant by Sunergy in Grimbergen). Finally, Intergem, with a respectable number of 289 installations >10 kWac, has an average capacity of 268 kWac/system. The reason: the Loghidden City terminal of Katoen Natie is in their region, and that largest installation in the Benelux alone has already 27,92 MWac evenly distributed among 22 sub-installations (1,27 MWac on average per section).
On the other hand, the net manager Intermosane has only few installations >10 kWac, and an average system size of 49 kWac. AGEM, which only had 74 kWac on average, has been sold to Iverlek and will not further be identified as such in the listing by VREG. GHA, the "Gemeentelijk Havenbedrijf Antwerpen", the organisation originally responsible for the net connections in the harbour region on Antwerp soil (hence: east of the river Schelde), had only 12 installations >10 kWac in the May 2011 report, with an average of 229 kWac per system. Their data have been included in those of IVEG that overtook the net managing task of GHA. One of the reasons is the fact that introducing a lot of PV-capacity in the "willing" Antwerp harbour area would generate a sharp rise in the electricity fee to be paid by the few clients in this (former) small net region. By taking over the net region by a much larger net manager, the costs for payments of green certificates to the PV-producers could be spread over far more customers, hence contributing only to a slight rise of the "green electricity renumeration". It came as no surprise that a short while after that take-over, several big PV-installations in the Antwerp harbour region made their entry in the monthly VREG updates...
It is, again, good to realize that Katoen Natie's impressive Loghidden City Terminal is not on Antwerp soil, but instead on that of the province of East-Flanders (West-Bank of river Schelde). Although it is often "mentally connected" to Antwerp because of the important, extensive harbour region in which it is situated. There are interesting but unverified "stories" being told why the major harbour city of Antwerp does not have the biggest installation of the Benelux on its premises. Besides, since Antwerp itself has "opened" its own market for large scale installations, Katoen Natie was one of the early birds to profit from that move - on the East Bank of the River Schelde (already several new entries in the VREG records)...
Flanders - renewable electricity mix shows clear PV component
From the last pdf document "Number of green certificates issued" of VREG the most actual pie diagrams have been calculated, from data provided in the period 2002 up till December 2011 (in earlier reports, VREG presented its own pie-diagram for green certificates issued). Note that also these diagrams are lagging behind with respect to the actual situation.
March 2, 2012 update
(1) Accumulation of all green certificates issued in 2002-2010
 |
^^^ This graph can - in theory - still change (minor corrections only) as new data for green certificates issued by VREG become available in more recent reports. Data for certificates issued in 2011 have not yet been included in the present graph. Status: © March 2, 2012 VREG Flanders |
(2) Green certificates issued for the year 2010 only
 |
^^^ This pie chart shows the number of green certificates issued only for the year 2010. Also for that year alone more certificates can be assigned afterwards. It is clear that the share of photovoltaics in the "green mix" has risen fast, as compared to the accumulation graph for the years 2002-2010 shown above. PV already had 16% of the certificates issued in 2010 with the update shown here (March 2, 2012, including [highly preliminary] data provided up till December 2011). Note that, starting in the Feb. 1, 2012 report, the option "biogas from (mainly) agricultural sources" has been added. |
(3) Green certificates issued for the year 2011 only (preliminary, data far from complete!)
 |
^^^ This still highly incomplete pie chart shows the number of green certificates issued only for the year 2011. For this year alone many more certificates will be assigned afterwards. The share of photovoltaics in the "green mix" has risen further, as compared to the graph for 2010 shown directly above. PV here is represented with 28% of the certificates issued sofar in 2011 with the update shown here (March 2, 2012, including [highly preliminary] data provided up till December 2011). Note that this percentage is highly uncertain, since also for all the other options many certificates still have to be incorporated. These yet unknown data will be added in coming updates. |
The next diagram (new make-up by VREG since Feb. 2011) clearly shows the rapidly increasing and astonishing high impact of solar electricity in the "green" electricity mix of Flanders in a different way. In particular during the summer period the trend is unmistakable and undeniable (red segments):
 |
^^^ Vertical
scale is max. 400.000 certificates issued per month Note! Colours in this graph do not necessarily match with the ones used in pie-charts by VREG! Status: © March 2, 2012 VREG Flanders |
In the next graph, introduced for the first time by VREG in the Feb. 28, 2011 status report, the number of green certificates issued by VREG for (only) photovoltaics is given (for graphs for other "renewable" electricity generating options, please refer to the original VREG publication):
 |
In the summer of 2010 (blunt peak at right) already almost 77.000 green certificates for photovoltaics were issued by VREG (July), good for a volume of approximately 77 GWh. 2011 saw an explosive rise of green certificates issued for PV, in sunny May (last peak, data at right), already a level of more than 133 GWh has been reached, with potential for much more in coming sunny sommer months with rapidly expanded capacities. Status: © March 2, 2012 VREG Flanders |
Finally, the last graph in this section shows the green certificates that have already been issued and that, for the biggest part, already have been used as guarantees of origin (GO's) for use of solar electricity in Flanders up till, and inclusive, December 2011:
This graph shows that almost 489 GWh of green certificates have been issued for solar electricity produced on Flemish soil in 2010 (yellow column segment). And that still 106 GWh of these green certificates were in the waiting line to be validated as "green electricity actually sold as such" (green column segments, still to be used as guarantuees of origin, GO's).
The available data up till December 2011 (final column) show that growth in certificates issued for PV is very strong, with already 982 GWh having been acknowledged by VREG in 2011, probably more to be approved in the waiting line, as well as many more GWh's that will be added later in the year. A considerable volume (226 GWh, 23% of certificate total) still awaits use as a GO. It is possible that with backlog certificates to be added, a level of 1 TWh could be reached in 2011.
For 2010 only, the share of solar electricity in the green mix has reached a level of 15,9%, while in 2009 this was only 5,3%. Due to backlog of certificates, this percentage still could change in the course of time and become a little bit higher (minor correction expected). The share in total electricity consumption has already broken the 1% barrier.
Special: official date of VREG approval for projects >10 kWac
A new interesting data found in the first Excel spreadsheet on the VREG site (January 31, 2011), is the official date of approval for the bigger (>10 kWac) projects listed by VREG ("datum indiensttreding"). This information has not been available in the monthly pdf documents issued by the organisation up till the end of 2010, but is found in the recent documents published in 2011. I made some new graphs based on this interesting new "feature" in the VREG records (status: March 2, 2012 report).
This first graph (above) shows the official installation date for the number of PV-systems >10 kWac per month according to VREG (note that a few smaller older systems apparently have been withdrawn from the VREG list in previous updates for unknown reasons). The first 3 (remaining) installations have date-stamps for January 2006 - the earliest PV-systems recorded with VREG (there are still much older existing installations in Belgium, of course). Crystal-clear from this graph is the huge installation peak in December 2009, in which now 770 installations >10 kWac were awarded official recognition by VREG. The level dropped however dramatically immediately in January 2010 (just 1 installation in this category), and revived to a much lower level of 653 new installations >10 kWac in December of that year (85% of the number for Dec. 2009).
In 2011 initially only few installations had been registered for this category, but growth revealed in later month reports is striking, including the adjusted numbers for the earlier months. Prior to the degression of green certicifate value as of July (degression dates indicated with vertical dashed red lines), another strong installation peak materialised, 734 for the >10 kWac category, already beyond the peak in December 2010. After that only 157 new installations were reported by VREG in this category, with a minor September installation peak prior to the next degression date, October 1, 2011.
VREG still has to work out their backlog of PV-systems reported to them, in particular for this category with large PV-installations. The number is growing, and with present status, is likely that the high December level seen in 2009 will be reached. October 1, 2011, another degression of tariffs has been implemented, resulting in feed-in levels of 27 Eurocent/kWh for installations up till 250 kWac, and only 15 Eurocent/kWh for larger installations. Sofar, this resulted in only 135 new installations >10 kWac in the "pre-tariff-change" month, September. These tariffs have been adjusted even more since January 1, 2012: 25, and 9 Eurocent/kWh, respectively. The big question is: has it become impossible to exploit a large PV-installation under the most recent conditions, or is it just a matter of extreme profit-based thinking that almost no new installations were allocated by VREG in the final months of 2011?
In this second graph the same is shown as in the previous one, but now the total solar capacity added for each month that new installations got official "green light" from VREG is shown (in MWac of accumulated capacity). In this graph it is clear that the peak for December 2009 is not a record anymore, with now almost 168 MWac of >10 kWac projects in one single month. The December 2010 peak, with now almost 157 MWac, is still only 7% lower. From these graphs it is clear that for this specific category of larger PV-installations, the end of the year has been the most important period to finalize these projects. For 2011, the pre-July-degression month June now already has more new capacity in the >10 kWac category than December 2009. Already 192 MWac has now been reported as "new" for that month, 15% more than the December 2010 peak. In the pre-October-degresion month a smaller peak occurred, with 23,9 MWac new additions. That volume is more than the total volume added in the whole year of 2010 in the Netherlands. Much more capacity additions can be expected for Flanders...
Still another data-set is shown in this last graph. Now, not the date of registration is given, but the date on which first green certificates have been issued for the installation: for most bigger installations this is most probably close to the date of official grid-connection, with the PV-system going "on-line" and physically producing energy. Only the graph with the accumulation of capacity is given here:
In this graph, with accumulated capacity per month of first grid-connection / first issued GO's, the trend shows a much more even distribution in the course of time than in the previous 2 graphs. Relatively high peaks are seen just prior to the degressions of green certificate values, with a strong peak in September 2011 (over 55 MWac of installations receiving their first green certificates). After that, the volumes strongly decreased for the >10 kWac category. The "April 2010 certificate peak" is probably the result of many installations being finalized end of February that, by connecting to the grid at that time still could have obtained the right to receive a green certificate value of 45 Eurocent/kWh for 20 years.
Note that in Flanders, a monthly addition to the grid of at least 20-35 MWac of photovoltaic capacity apparently has become a "normal" level of progress in the year 2011.
In this final graph the official starting date for PV-projects >10 kWac has been given on a daily basis for the busiest month in Flemish history, December 2009 (again: March 2, 2012 report used for data). The number of projects awarded as such is indicated in yellow columns (with black numbers on the bottom line). The total capacity of all projects on the same day is given in orange-coloured columns with the accumulated capacity calculated in numbers on top of the columns (in MWac). The busiest day by far was December 23, with 75 new projects >10 kWac officially "started" according to VREG. The final day of the year, December 31, had 64 projects awarded. However, if one looks to capacity added on one day, the 31st of December 2009 got the trophy, with 17,34 MWac on a single day "officially approved". Note that weekend and holidays (Christmas) are under represented: no or hardly any PV-systems were allocated to these non-working days.
More
details on Flanders PV market
Wetenswaardigheden over de Vlaamse PV markt
Foto © AGF.nl, referentie: http://fotoalbum.agf.nl/PAViewAlbum.asp?ID=683&CMD=THUMB&page=2
Photo 3 - Small part of the installation on the renovated Mechelse veiling (according to VREG May 2010 report: 1,014 MWac) in Sint-Katelijne-Waver. According to an ensemble in the photo-album of AGF.nl 5.500 PV-modules would have been installed here, and 8.900 MWh a year of solar electricity would be produced. That is, however unlikely, because that would suggest 8.777 kWh/kWac a year production. Most likely, a yearly yield of 890 MWh (specific yield: 878 kWh/kWac.year) is applicable here, more in line with production mentioned in the AGF article (message of 22st of March 2010). A financial pay-back time of 6,5 years has been suggested for this installation, which could turn out to be true, because of the extremely interesting combination of predictable, hence calculable, financial incentives in Flanders in the period that this installation was connected to the grid. According to the V&R The Solarcompany website, that company from Heusden-Zolder would have realised this interesting PV project (see pdf).
Special: Distribution of PV-installations per community in Flanders
In De Standaard of 19 april 2011 an interesting overview of accumulated capacity per community (postal code) was given, based on data apparently provided by VREG. It includes total capacity, the accumulation of volumes for the two categories <= 10 kWac, plus the larger installations (>10 kWac). De Standaard wrongly quoted "number of PV-modules", but the table they presented clearly shows "accumulated kWac capacity", since for Beveren-Waas the number "29844" was given. This cannot cover number of installations (and certainly not to number of solar panels as wrongly suggested). It points instead to total accumulated capacity in kWac at that time. Beveren-Waas is the community in East-Flanders (West Bank of the river Schelde) having the Loghidden City terminal on its soil, and that accounts to 27,51 MWac.
In that article, also a link to a highly interesting image has been provided with "number of solar panels per community for private households". This most certainly also must be read as the accumulated capacity, with colour codes for 0-500 kWac up till a category of over 3.000 kWac in the community under consideration:
Capacity of PV-installations for "private persons" (households), in categories ranging from 0-500 kWac (yellow-green) up till > 3.000 kWac per community (dark green). Brussels is not included here (white "gap" at bottom). The yellow-green segment on the right is the so-called Voerstreek directly on the border of Netherlands Limburg (actually isolated in the surrounding area of Walloon region of Belgium). Provincial borders are indicated with thin white lines. Two "hot-spots" for private as well as for industrial size installations have been indicated with yellow stars by the webmaster of Polder PV: Beveren-Waas west of river Schelde on top (private segment in table 5.157 kWac), the star standing for the Loghidden City terminal of Katoen Natie with 27,9 MWac. According to the table in the Standaard article, industrial installations in Beveren-Waas would have amounted to 29.844 kWac at the time of publication. Secondly, Gent (households: 7.972 kWac), with the star indicating another concentration of Katoen Natie and other similar "logistics terminal" roof-projects (harbour region of Desteldonk / Sint-Kruis-Winkel): 20.561 kWac in total according to the table, at the time of publication.
In a separate press communication by VREG data have been provided for results per province and per net manager region (status April 18, 2011). From this document (linked below) it becomes clear that Eastern Flanders is the most "productive" province with respect to green electricity generation in 2010 (almost one million and a half green certificates being allocated by VREG, Flemish Brabant only received 117.000 certificates in that status update). Beveren-Waas has been the best producer of solar electricity (12.930 certificates, each valid for 1 MWh, in 2010). Which is, of course, directly related to the fact that the biggest single (multi-roof) PV-installation in the Benelux is present within its borders: 27,92 MWac Loghidden City terminal, the shining core of the Katoen Natie project...
For table with data, and detailed colour map, see the article link:
http://www.standaard.be/extra/zonnepanelen/
http://www.vreg.be/pers-2011-2
(April 18, 2011: press communication in Dutch considering "statistics
of green electricity and co-generation per community, province, and net
manager region", with several interesting data in a Word document)
Dutch summary of most important extra findings from the VREG data for the Flemish PV market. Status report: March 2, 2012.
"Wij geraken dit jaar nooit voorbij de 150 megawattpiek. Vooral de residentiële projecten delen in de klappen en zijn nog maar goed voor 30 megawattpiek. Met het jaareinde in zicht en een nieuwe aanpassing van de groenestroom-certificaten verwachten we wel een opleving, maar deze is relatief beperkt. Er zal zeker geen rush zijn zoals vorig jaar", verduidelijkt Herman Daniëls." Met dat soort uitspraken (en andere, in het artikel), hier geciteerd uit de mond van de ondervoorzitter van sector organisatie BelPV (nu PV-Vlaanderen geheten), over de "voorspelde" afzet markt van zonnepanelen in 2010 in Vlaanderen, haal je geen wit voetje bij de politiek. Feiten stand van zaken VREG 1 maart 2012 [meest recent verkrijgbare data]: 2010 344 MWac waarvan 152 MWac installaties tm. 10 kWac (meer dan Daniels voor heel 2010 had voorzien). Alleen al in december 2010 werd het door Daniels voor heel 2010 geopperde volume overtroffen met alleen de >10 kWac installaties (zie figuur). NB: MWp vermogen van nieuwe STC capaciteit aan zonnepanelen ligt nog een stuk hoger (is niet bekend). Daniëls zat er voor heel 2010 dus minimaal een factor 2,3 naast wat het totale volume betreft, en minimaal een factor 5 m.b.t. de kleine ("residentiële") systemen. Ook voor 2009 schatte Daniëls nogal verkeerd in met 380 MWp. Het was volgens genoemde VREG update in dat jaar al 453 MWac, wat mogelijk neer komt op een DC generator vermogen van zo'n 499 MWp... Citaat komt uit het artikel "Zware terugval in verkoop zonnepanelen" van 4 oktober 2010 op Livios.be |
| VREG
jaarrapport 2010* |
VREG rapportage 2 mrt. 2012 (MWac) |
|
| Vóór 2006 |
1,498 |
1,484 |
2006
|
2,162 |
2,159 |
2007
|
22,046 |
22,046 |
2008
|
67,117 |
67,075 |
2009
|
445,821 |
453,306 |
2010
|
253,780 |
344,428 |
2011 |
--- |
647,760 |
2012 |
--- |
11,130 |
| * VREG "Marktrapport 2010" (publicatie datum 5 augustus 2011), Hoofdstuk 5 Hernieuwbare energiebronnen en warmtekrachtkoppeling. NB: oudere installaties die niet (meer) "in aanmerking komen voor de toekenning van groenestroom certificaten" vallen dus buiten deze cijfers. Het betekent echter niet per definitie dat die oudere installaties afgebroken (zullen) worden. | ||
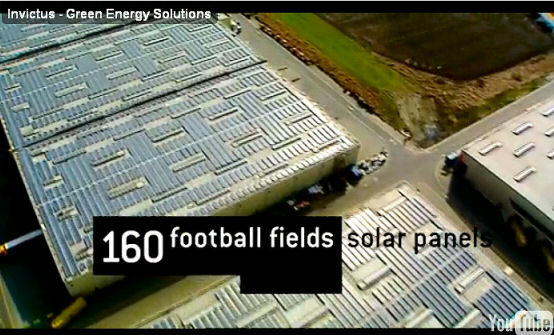
©
Invictus NV,
Wilrijk, Flanders, Belgium.
Photo 4 - Video still of the highly interesting, 3 minutes
long company
video of Invictus NV from Wilrijk (near Antwerp) in which nice
shots can be found of the preparations for, and installation work
pertaining to this massive roof-oriented PV-project, the biggest in
the Benelux countries sofar. Two of the huge logistics halls of Katoen
Natie - here on the video still - have been painstakingly filled with
Trina Solar modules (big Chinese module quality producer) wherever
they seemed to fit.
* Ter vergelijking: in het jaarverslag 2010 van CertiQ voor de "Nederlandse gecertificeerde productie van hernieuwbare elektriciteit" werd gewag gemaakt van slechts 8.309 MWh aan (NB: alleen gecertificeerde) zonnestroom productie voor dat jaar. In het februari 2012 rapport van CertiQ werd een accumulatie (!!!) van 75.051 certificaten (elk 1 MWh, totaal dus 75 GWh) sinds 1 juli 2001 gerapporteerd. Waarmee duidelijk wordt dat de "gecertificeerde" productie van zonnestroom in Nederland (lees: de kWh productie waar het allemaal om draait en die "ten faveure van de kabinets-doelstellingen zou mogen worden toegerekend"...) nog steeds niets voorstelt. Vlaanderen zit daar al bijna een factor 22 overheen. Met daarbij wel de kanttekening dat het overgrote merendeel van de (paar tienduizend) PV-systeempjes in Nederland nooit in de CertiQ gegevens is bijgeschreven en ook nauwelijks wordt bemeten (en zeker niet "gecertificeerd"). Wat duidelijk maakt dat die database dus ook nog eens een zeer slecht referentiekader is om de totale productie van zonnestroom in Nederland aan "af te meten".
©
HBVL.be (this
webpage).
"Free-field" PV-plant, probably the Diepenbeek (?) lock along
the Albert Canal between Hasselt and Genk, province of Limburg, Flanders,
Belgium.
Photo 5 - An interesting new phenomenon in the application of
photovoltaic generation of electricity: solar power plants along channels
to produce green electricity for heavy-power locks in those waterways.
In the VREG reports, two such PV-plants have been included. A 429 kWac
installation near the lock of Mondeolaan in the industrial area of Genk-South.
And a 462,5 kWac installation near "Het Sas", the lock along
the Boksbeemdenstraat in NE Hasselt (both in Limburg province in the eastern
part of Flemish territory). These were registered under the newly erected
company Zonnecentrale De Scheepsvaart NV in the December 1, 2010
project listing. A good initiative, but a third project in between these
two VREG-registered projects, near Diepenbeek lock, has been seriously
questioned earlier in 2010 by a spokesman of the Groen! (green) party
since there were a lot of problems with permits and questionable connections
between interested parties (see this
document with critical questions by spokesman Peeters to Minister
of public affairs of the Flemish Parliament, Crevits, and this
news item on the HBVL webiste). Also windpower (see photo), and sometimes
even hydropower are used for the high electricity needs for such locks.
© IZEN, photo from project page of the PV-system developer
Photo 6 - Aerial view of the two large blocks of the Zonnecentrale Overpelt NV on the premises of the metal producer Nyrstar (old deposit fields for zinc tailings, 13 hectares covered) in the heavy industry complex "Overpelt werkplaatsen" near Overpelt, along the Zuid Willemsvaart canal visible in this photo, running left to right. Location: Flemish province of Limburg not far from the border with Netherlands. System developer IZEN, famous for its beautiful large-scale PV-installations in Belgium, built this project, and the first multicrystalline 54-cell module was symbolically installed on the first of October 2010 by project partners Group Machiels*, Nyrstar, LRM*, Gemeente Overpelt and IZEN (see also press release by Nyrstar and video on TV Limburg). The project has been realized completely in 2010. In the background the greyish-blue surfaces are small artificial lakes, north of the Zuid Willemsvaart in the "Kolonie" region bordering the province of Noord Brabant in Netherlands.
There has been some confusion with respect to the ultimate size of this free field, ground-mounted project, in early 2011 the largest of its kind in the Benelux (pushing long-time 4,7 MWac Heusden-Zolder in the same province to the second position). IZEN claims having built an installation of 7,6 MW, with 36.192 modules (hence, an average-size 210 Wp/module, a normal type for such a modern installation). Thus, most probably 7,6 MWp (STC nominal DC-power) has been realized. However, initially 2 new >6 MWac project entries "Zonnecentrale Overpelt NV" were included in the VREG database in the April 5, 2011 month report. Apparently that was a mistake, since the second 6 MWac entry has been removed in the May 2, 2011 report by VREG.
The 7,6 MW[p] installation reported by IZEN/Nyrstar would generate an amount of electricity "equivalent to that used by 2.000 households". If the frequently quoted 3.500 kWh/household.year would be used, that would indicate a production of 7 GWh/year. Taking the 7,6 MW system size mentioned by IZEN, this would lead to a specific yield of 921 kWh/kWp.year, which seems to be a more realistic value for such an optimized large, south-oriented free-field installation than the often quoted (but rarely documented) 850 kWh/kWp.year specific yield claim in Belgium.
Investment has been "over 20 million Euro" according to IZEN, which means that at least 2,63 Euro/Wp would have been paid for the whole system. Even if it would turn out to be somewhere in the range of € 3,00, it would be a "fair" price for Flanders, where sometimes developers complain to the government that planned degressions of the value of the green certificates earned by PV-installations are going to fast for large, utility-size systems such as the present one. That could claim 35 Eurocent/kWh produced for 20 years since this particular project was realized in 2010...
* Group Machiels and LRM are the most important shareholders of "Zonnecentrale Limburg", planning more of these large-scale PV projects on parcels of waste land not usable for other purposes. Nyrstar consumes all the electricity produced on-site.
http://www.izen.be/professioneel/nieuws_2/pv/izen-bouwt-grootste-zonnecentrale-van-de-benelux/
Photo 7 - The future of the Flanders / Belgium solar market? Small-scale photovoltaics on an ancient building in the heart of Gent (16 multicrystalline modules, possibly a generator of 3 kWp or slightly more). Most probably with considerable shading effects by the chimneys at the eastern and western sides of the system. And more troubles looming from the high buildings surrounding this system. A somewhat different scale as that shown by the many hundreds of large industrial PV-installations that materialised in 2009-2010. But at least a stable basis to build upon for further photovoltaic development in Belgium.
Photo taken during Intersolution visit in Gent, by the webmaster of Polder PV, at the end of freezing-cold January 2011.
Conclusion
PV-capacity in Flanders Region/Conclusie Vlaanderen
Based on the newly revised, but still not "definitive" data
(VREG year reports (2009, 2010), and, in particular, the latest revision/update,
March 2, 2012) and the preliminary results for 2010, we can conclude with
the following estimates (rounded figures). See also graphic year results
on separate webpage, on
which also a final update is given (spreadsheet by VREG with year data).
Met de herziene gegevens zoals hierboven weergegeven (o.a. gebaseerd op
de jaarrapporten van VREG, de laatste van 2009 en 2010, en vooral de revisie
gepubliceerd 2 maart 2012), en de voorlopige resultaten voor 2010, kom
ik op een voorlopige schatting voor PV in Vlaanderen (afgeronde getallen).
Zie ook het grafische jaaroverzicht op een aparte
pagina, waar ook de allerlaatste update wordt weergegeven (VREG spreadsheet
met jaar data).
Accumulation 2011
(VREG)/Accumulatie 2011 (VREG) 1.538,3
MWac (1.692 MWp*)
Growth in 2011 (VREG)/Groei in 2011
(VREG) 647,8 MWac (713 MWp)
73%
growth with respect to 890,5 MWac end of 2010
73% groei t.o.v. 890,5
MWac eind 2010
Accumulation 2010
(VREG)/Accumulatie 2010 (VREG) 890,5
MWac (980 MWp*)
Growth in 2010 (VREG)/Groei in 2010
(VREG) 344,4 MWac (379 MWp)
63%
growth with respect to 546,1 MWac end of 2009
63% groei t.o.v. 546,1
MWac eind 2009
Accumulation 2009
(VREG)/Accumulatie 2009 (VREG) 546,1
MWac (601 MWp)
Growth in 2009 (VREG)/Groei in 2009
(VREG) 453,0 MWac (498 MWp)
488%
growth with respect to 92,8 MWac end of 2008
488% groei t.o.v. 92,8
MWac eind 2008
Accumulation 2008
(VREG)/Accumulatie (VREG) 2008 92,8
MWac (102 MWp)
Growth in 2008 (VREG)/Groei in 2008
(VREG) 67,1 MWac (74 MWp)
261%
growth with respect to 25,7 MWac end of 2007
261% groei t.o.v. 25,7 MWac
eind 2007
* Conservative conversion factor maximum inverter AC power > MWp generator power (DC): 1,1
Increase of yearly growth 2011 with respect to that in 2010/Toename van de jaarlijkse groei van 2011 t.o.v. die in 2010: factor 1,16
Decrease of yearly growth 2010 with respect to that in 2009/Afname van de jaarlijkse groei van 2010 t.o.v. die in 2009: factor 0,13
Increase of yearly growth 2009 with respect to that in 2008/Toename van de jaarlijkse groei van 2009 t.o.v. die in 2008: factor 1,87
Number of inhabitants
Flanders Region (exclusive of Brussels, which has 1.145.292 inhabitants,
this
link, status: December 1, 2011): 6.251.983 (Vlaams Gewest, 2010)
Aantal inwoners Vlaams Gewest (= exclusief Brussel, wat 1.145.292 inwoners
telt, deze
link, status: 1 december 2011): 6.251.983 (Wikipedia;
ref. year 2010)
PV-capacity per inhabitant
Flanders Region estimated for end of 2011: 271
Wp/capita**
PV-capaciteit per inwoner van Vlaams Gewest geschat voor
eind van 2011: 271 Wp/hoofd**
** (Factor AC > DC: 1,1). End of 2009 this was approximately 96 Wp/capita (according to most recent VREG data for that year, published March 2, 2012). See also interactive graph.
The
rest of Belgium: Walloon region and Brussels
(updated up till 2011 - preliminary data)
De rest van België: Wallonië en Brussel
(ververst tot en met eind 2011 - voorlopige schattingen)
Wallonië/Region Wallonne/Walloon Region ("Waalse Gewest")
Latest news:
data February 29, 2012
CWaPE
produced latest data on Walloon Region's development in photovoltaics.
Date stamped February 29, 2012.
Apere data
at start of 2012
The development of "renewable" electricity ("électricité
verte") in the French-speaking part of Belgium, Wallonië (including
a small enclave in which German is spoken) is regulated by the Commission
Wallonne pour l'Énergie, CWApE. In their numbers also fossil-derived
combined power generation is considered as "green" electricity,
which is, of course highly debatable. These installations also receive
"green certificates", in French "certificats de garantie
d'origine". The Walloon "renewable" market is split in
two segments, installations up till 10 kilowatt (AC, or "kilovoltampère",
kVA), for which certificats are relatively easy to obtain and to get paid
for. And the category larger than 10 kW. The bulk of the photovoltaic
installations in Wallonië is residential, and thus is included in
the "small" category. At the end of 2008 there were only 7 installations
>10 kWac, with a combined power of 167 kWac known as "certified"
in the CWApE registration.
The website of CWaPE is not very clear and it takes a lot of time to find the documents in which market development for PV is described. This, in addition with bureaucrats' French not being the easiest language, makes interpretation of the data tedious. It would be nice if a separate statistics page (for photovoltaics and for other renewable energy options) would be included, such as can be found on the website of their Flemish colleagues of VREG.
The most convenient, "rough" overview has been given by the French organisation Apere which publishes the bi-lingual magazine "Renouvelle", or (Dutch alternative) "Hernieuws". This magazine publishes the trends in the three regions of the country, Flanders/Vlaanderen, Walloon Region/Wallonië, and Brussels, on a yearly basis. In the Januari 2012 issue this graph appeared for the status in Wallonië:
In this graph (© Apere), which apparently gives the AC-capacity of the PV-installations (in the French-speaking part of Belgium, reference is given to the "MWc"-capacity), I added the year on year growth percentages in the top segment. In orange columns, the accumulated capacities at the end of each year, in dark-blue columns the yearly growth volumes. The results for 2011 have been extrapolated in a linear fashion by Apere, based on the last known data from September 2011. Hence, these data might still change (Walloon Region has known a typical "end of year rush" of installations, hence some uncertainty with regard to the precise year volume still lingers).
Like many countries or regions still at the start of their PV-market development in modern times, Walloon Region more or less doubles its year volume each year. The first years in this still relatively young market saw much larger growth.
In a more recent listing by CWaPE (January 31, 2012), the >10 kWac inventory accumulated 90 installations with a total AC capacity of 6,492 MWac. Average "large system size" in that list was 72,1 kWac per PV-system. The two biggest installations there had a size of "only" 250 kWac (one in Ghlin west of Mons, and one in Strépy-Bracquegnies west of La Louvière).
If we subtract that 6,5 MWac of "large-size" installations from the calculated end of 2011 volume by Apere, still a very strong volume of app. 180 MWac remains for the installations up till 10 kWac. Hence: the Walloon market is absolutely dominated by small residential PV-installations, and the market for big systems on flat roofs of large companies still has not materialized, or is still in a very young stage of development. This is a very big contrast with the Flemish market, which has a large segment of installated capacity in the commercial domain (status 2011: 46 percent with respect to accumulated capacity...).
Also note that in one year time the Walloon Region has surpassed the total accumulation of photovoltaic capacity in the Netherlands (only appr. 112 MWp nominal generator capacity as of Jan. 1, 2012) with almost double that volume... (Flanders had done so in 2008, and since then left Netherlands far behind with record new volumes in 2009-2011).
Note that data presented below are from older research, they will have to be updated.
 |
^^^ (Note: Y-axis with logarithmic scale!) Number of certified installations receiving green certificates that were registered with CWaPE end of 2008. Stacked: installations 10 kWac or smaller (light green), and on top of that those larger than 10 kWac (dark green). At left PV-installations, in that year 2.678 installations were registered. Data: CWaPE 2008 report (pdf) |
2008
On October 13, 2009 the 2008 report was published. The most important
data, status end of 2008:
 |
^^^ (Note: Y-axis [kW] with logarithmic scale!) Total accumulated certified capacity of installations that receive green certificates and that were registered by CWaPE end of 2008. Stacked: installations with max. size of 10 kWac (light green), and systems larger than 10 kWac (dark green). Left the PV-installations, in total 8,928 MWac registered. Data: CWaPE 2008 report (pdf) |
2009
An interesting diagram with "small generation facilitie"
in Walloon Region by CWaPE:
Detail from screendump of CWaPE document [pdf] showing enormous growth in capacity of "installations for decentralized production" of maximum 10 kVA (kilovoltampère) in the Walloon region, since November 2008 (3 data points). Please refer to the last set of three columns - the rest of the graph showed the distribution among the different net manager regions. "Régie de Wavre" is just visible on the left in this graph, the right ensemble shows the relevant total for all net regions ( "Total général"). The columns most probably represent (or: include) all the < 10 kVA PV-installations connected to the grid in this one-year period. Growth is staggering: from app. 7,7 kVA in November 2008 (blue, "nov-08"), via 25,3 kVA in August 2009 (red, "août-09"), up till 40,1 kVA in November 2009 (green, "nov-09"). Difference between the November data is 32,4 kVA of installed capacity. This will not be exclusively PV, but it certainly represents the booming private PV-market segment for the biggest part. |
 |
More info
Other interesting data can be derived from the ef4.be
database containing grid-connected PV-installations in the Walloon
region and capital Brussels (the latter under postal code 1000, interactive
sorting possible). The database had almost 4.900 installations end of
January 2012 (most: residential projects).
Two typical bigger PV-projects in the French regions of Belgium are the "Galaxia" 300 kWp façade project in Libin-Transinne (province of Luxembourg), that even made it in an article in the September 2009 issue of Photon. According to Photon, it should have 3.648 multicrystalline modules on the roof of a joint-visiting centre for space-industry companies. The strange thing is, that, more than two years later in the recent CWaPE listing for "bigger" projects only an entry of 152 kW has been assigned to the Galaxia project.
In the ef4.be database also a 55 kWp installation on the Belgacom Towers in Saint-Josse-ten-Noode (direct north of the Brussels city center) has been included, with 250 pieces of 220 Wp SolarFabrik modules. However, this entry can not be found at all in the present CWaPE listing. This shows that apparently there are hiatuses in the "official" data, and that more capacity might have been installed than the authorities think...
Incentives
Walloon region are decreased
Also in Walloon region, incentives are reduced, as PV-modules become cheaper
and cheaper in time. For reference, see these reports:
http://tinyurl.com/yfh5jzj
(link on Photovoltaikforum)
http://www.bruxelles-renouvelable.be/sites/default/files/hen20_Web_press.pdf
(pdf 1,52 MB; threat of worsening condition for Walloon region, in
Dutch)
Conclusion
PV-capacity in Walloon Region/Conclusie Wallonië
With the most recent data given by Apere, I come to this estimate for
PV in the Walloon region:
Accumulation 2011/Accumulatie
2011 186 MWac*
Growth in 2011/Groei in 2011
94 MWac
102%
growth with respect to 92 MWac end of 2009
102% groei t.o.v. 92 MWac
eind 2009
Accumulation 2010/Accumulatie
2010 92 MWac
Growth in 2010/Groei in 2010
46 MWac
96%
growth with respect to 47 MWac end of 2009
96% groei t.o.v. 47 MWac
eind 2009
Accumulation 2009/Accumulatie
2009 47 MWac
Growth in 2009/Groei in 2009
37 MWac**
422%
growth with respect to 9 MWac end of 2008
422% groei t.o.v. 9 MWac
eind 2008
Accumulation 2008/Accumulatie
2008 9 MWac
Growth in 2008/Groei in 2008
9 MWac**
Number of inhabitants
Walloon Region: 3.456.775
Aantal inwoners Brussel: 3.456.775 (Wikipedia)
PV-capacity per inhabitant
of the Walloon Region expected in 2011: 54
Wac/capita
PV-capaciteit per inwoner van Wallonië verwacht in
2011: 54 Wac/hoofd
Note that in 2012 approximately 24,6 MWac with 4.314 new photovoltaic installations have been added, based on a report date-stamped Feb. 29, 2012 by CWaPE.
*
Preliminary results, calculated from status September 2011.
**
Photon
auteur Christoph Podewils wrote in June 2009 about 9 MW newly installed
capacity in 2008 and "possibly 20
MW new in 2009" for Walloon region. These estimates have long been
overhauled by more aggressive new capacities reported.
Brussel/Bruxelles/Brussels (Apere estimate end of 2011)
For Brussels we must, regrettably, check with still another authority in the country full of bureaucrats and biblical language problems stemming from the age of Babylon. The name is, officially, "Reguleringscommissie voor energie in het Brussels hoofdstedelijk gewest", Brugel. For some older statistics, see below.
However, also here Apere has given a helping hand in the same report with the numbers for Walloon Region. Here is the verbose result for Brussels:
Graph © www.renouvelle.org. Note: most recent graph from Renouvelle Jan. 2012, showing slightly deviating numbers for Brussels, a little bit higher than those published separately by Apere).
Again, apparently AC-capacity of the PV-installations, to which I have added the YOY growth percentages in the top segment. In orange columns, the accumulated capacities at the end of each year, in dark-blue columns the yearly growth volumes. The results for 2011 have again been extrapolated in a linear fashion by Apere/www.renouvelle.org, based on the last known data from September 2011.
In contrast to the Flemish and Walloon PV-market, Brussels has seen a deteriorating trend with newly build installations and strongly decreasing YOY percentages. Of course, Brussels has little space for large-size installations, but the Walloon region revealed that even if there would be "space" available, that is not sufficient for true market growth (it did not take place in Wallonië). Brussels has lots of high rise buildings and therefore, space in the built environment is scarce or at the best "troublesome" from an installers point of view (lots of shading, small surfaces, problematic roof access, etc.). In addition, the authors from www.renouvelle.org say that Brussels never had a specific plan to develop a photovoltaic market of their own, like their Walloon colleagues have deployed (Plan Solwatt, end of 2007).
Hence, the "boom" of 2009 in the capital of Belgium has not replicated in following years. In 2011 up till now, even in the "updated" version published in the Renouvelle web magazin, sofar only 1,1 MWac of new installations have been reported in 2011, bringing the total accumulation for Brussels on a meagre 7,0 MWac. Which is a very bad perspective for the capital of Belgium. Brussels remains a "mini-market" within the overkill of Flemish PV-installations. Even the national airport is not on Brussels soil, and therefore, the 1,66 MWp installation on the Brucargo terminal is counted by VREG for Flanders, not by BRUGEL for Brussels...
There is, however, one bright lightray in these gray surroundings. The TIR centre in Brussels harbour area would receive 17.000 PV-modules this year with a total capacity of 1,6 MW, to be installed by the company Blue Lines (see article of October 6, 2011, on website Lloyd). However, in September 2012 it appeared that "only" 1,2 MWp has been installed (details to be found in my article of September 27, 2012). That addition would be 17% of the accumulated volume in Brussels reported for end of June 2012 (6,9 MW according to Brugel)...
From Brugel older - but illustrative data - from 2008, in a publication dated October 30, 2009.
 |
^^^ © Brugel, 2009 (pdf) |
Data from this older report:
2009
In
an article
on the informative website of Bruxelles-renouvelable.be 2009 trends have
been outlined. Their estimate was app. 3 MWp end of year, but this has
been underestimated (see above for more recent data). They provided this
graph:
 |
<<< BHG = "Brussels Hoofdstedelijk Gewest" © Bruxelles-renouvelable.be (this link). |
Conclusion PV-capacity in Brussels/Conclusie Brussel
With the most recent data provided above, new estimates for Brussels are as follows:
Accumulation 2011/Accumulatie
2011 7 MWac*
Growth in 2011/Groei in 2011
1,1 MWac
19%
growth with respect to 5,9 MWac end of 2009
19% groei t.o.v. 5,9 MWac
eind 2009
Accumulation 2010/Accumulatie
2010 5,9 MWac
Growth in 2010/Groei in 2010
1,5 MWac
34%
growth with respect to 4,4 MWac end of 2009
34% groei t.o.v. 4,4 MWac
eind 2009
Accumulation 2009/Accumulatie
2009 4,4 MWac
Growth in 2009/Groei in 2009
3,7 MWac
633%
growth with respect to 0,6 MWac end of 2008
633% groei t.o.v. 0,6 MWac
eind 2008
Accumulation 2008/Accumulatie
2008 0,6 MWac
Growth in 2008/Groei in 2008
0,6 MWac
Number of inhabitants
Brussels: 1.145.292
Aantal inwoners Brussel: 1.145.292 (Wikipedia)
PV-capacity per inhabitant
of Brussels expected in 2011: 6 Wac/capita
PV-capaciteit per inwoner van Brussel verwacht in 2011:
6 Wac/hoofd
Estimation
for PV-capacity (growth in) Belgium
Schatting PV-capaciteit geheel België
Based upon the (preliminary and monthly revised) data for Flanders (VREG), Walloon Region (CWaPE), and Brussels (BRUGEL) in combination with the latest numbers provided by Apere/Renouvelle in the previous sections, we can make rough estimates for the whole of Belgium:
2008 accumulation: 93 + 9 + 0,6 = 102,6 MWac
(shares 91, 9, and 0,6%, respectively, for Flanders, Walloon Region, and Brussels)
EurObserv'ER estimated in their overview of development of the PV-market in Europe (10th State of Renewables report, publ. March 2011, download from this page) for Belgium as a whole 70,870 MWp (DC capacity) accumulated grid-connected capacity for 2008. A strong under-estimation at that time.
2009 accumulation: 546 + 47 + 4,4 = 597,4 MWac**
(shares 91, 8, and 0,7%, respectively, for Flanders, Walloon Region, and Brussels).
Growth 2008 >>> 2009 for Belgium as a whole: approximately 495 MWac (rounded). By which the "small" country Belgium possibly more than doubled the growth volume of its sunny neighbour France (Eur'ObservER / barobilan11: 215 MWp DC capacity new grid-connected in 2009, for Belgium strictly grid-connected capacity [including inverter in place!] Eur'ObservER published only 324 MWp of new capacity in 2009)...
2010 accumulation: 890 + 92 + 5,9 = 987,9 MWac
(shares 90, 9, and 0,6%, respectively, for Flanders, Walloon Region, and Brussels)
Growth 2009 >>> 2010 for Belgium as a whole: approximately 391 MWac.
(Eur'ObservER / barobilan11 had a preliminary volume of 518 MWp in their overview, which relates to the fact that installations not yet formally connected tot the grid end of 2009, are included in their 2010 statistics. Volume for 2009 + 2010 for Eur'ObservER data is 842 MWp, AC capacity according to Belgium administrations has been 886 MWac, which could account to a volume of app. 975 MWp, 10% more...)
2011 accumulation: 1.538 + 186 + 7,0 = 1.731 MWac****
(shares 89, 11, and 0,4%, respectively, for Flanders, Walloon Region, and Brussels)
All-in YOY growth Belgium 2010 >>> 2011: 743 MWac (growth of 75%). Still much capacity addition to be expected, in particular in Flanders/VREG stats.
Number of inhabitants Belgium - PBR data 2011* is used, 11,0 million:
PV-capacity per inhabitant of Belgium expected end of 2011 : 157,4 Wac/capita. If that number is correct, than a photovoltaic module of app. 173 Wp (DC) might be in place per inhabitant of Belgium. A very good place in the rankings (in 2010 Belgium would have occupied the fourth position in between Spain and Italy).
* 2011 World Population Data Sheet [pdf]of the Population Reference Bureau of the United Nations: 11,0 million halfway 2011.
** The renewable energy promoting organisation Edora published an extensive study with renewable energy market predictions for 2020 in February 2010. In that report, a graph has been published in which Edora claims that the Belgium photovoltaic market could have accumulated to 304 MWp (DC capacity) in 2009. That has appeared to be a very low estimate, far below actual realisation. See article published on February 13, 2010.
*** In Photon International of February 2010, in an article by Garrett Hering and William P. Hirshman (including reference to earlier preliminary data and prognoses by Polder PV), the following preliminary estimates were given by Jo Neyens of BelPV (233 MWp added in 2009 in Belgium), as well as by Photon Consulting that made a prognosis of 275 MWp growth for 2009 (and a forecast of 500 MWp for 2010...).
**** Preliminary results that can be adjusted considerably.
Previous
articles about the Flemish/Belgium market on Polder PV (Dutch)
Eerdere stukken op Polder PV over het PV-mirakel Vlaanderen...
...
maar wat levert dat nou allemaal op, daar in Vlaanderen/België? Zoet
en zuur (2 februari 2012): Energie productie resultaten bij zonnestroom
installaties in Vlaanderen.
Eerste
voorlopige resultaten PV-markt Vlaanderen: al minstens 519 MWac nieuwbouw
in 2011 (9 januari 2012): Met nieuwe grafieken voor jaargroei cijfers
PV markt Vlaanderen.
2011: Record
PV vermogen in Vlaanderen (24 december 2011): Grootste groei van PV-capaciteit
in Vlaanderen verwacht voor 2011.
Vlaanderen stoomt
lustig weiter met reeds 402 MWac in 2011 (12 december 2011). Onverwacht
(grote) Nederlandse participaties in PV-capaciteit Vlaanderen.
VREG update
Vlaanderen: groei zet onvervaard door (23 november 2011): Met nieuwe
grafiek: capaciteit op datum van eerste uitreiking groencertificaten.
Grenzschlängeln (10 oktober 2011):
Fiets avonturen rond Zuid-Limburgse grenzen, inclusief enkele zonnestroom
ontdekkingen in de Voerstreek en aangrenzend Wallonië - foto reportage.
Dansen op zonne-energie
(25 augustus 2011): Fiesta festival in Gent met faciliteiten werkend op
zonnestroom.
Polder PV feliciteert
Vlaanderen: > 1 GWp ! (23 augustus 2011): In de zomer van 2011
is Vlaanderen waarschijnlijk de magische grens van 1 GWp aan zonnestroom
capaciteit gepasseerd.
Is de
"zonnestroom park" sector in Vlaanderen dood? (23 mei 2011):
Donkere tijden voor grote zonnestroom projecten in Vlaanderen.
VREG update
Vlaamse PV-markt 2 mei 2011 (19 mei 2011): Update met kaartje zonnestroom
capaciteit per gemeente in Vlaanderen.
Surprise machine
Vlaanderen draait door (27 april 2011): Fraaie grootschalige PV-projecten
en de eerste honderd-duizend installaties gerapporteerd door VREG.
Volledige
revisie en aanvulling PV marktcijfers Vlaanderen (31 maart 2011):
N.a.v. het gesignaleerde "DC/AC" capaciteitsprobleem zijn door
Polder PV alle cijfers en statistieken van de Vlaamse zonnestroom markt
herzien.
Herziening
jaarlijkse groei data Vlaamse PV-markt (21 maart 2011): DC wordt AC:
het capaciteitsprobleem voor het bepalen van de marktgroei in Vlaanderen
nader aan de tand gevoeld.
Weer
een artikel van Polder PV op SolarPlaza: Belgische marktontwikkeling
(8 maart 2011): Op verzoek van SolarPlaza produceerde Polder PV een analyse
van de zonnestroom markt in België in 2010.
Links
tegenover Rechts: Antwerpen wil nu ook vet scoren met zonnestroom
(11 februari 2011): Hoe Antwerpen de mogelijkheid schiep om vet van bil
te gaan met zonnestroom, daarbij jaloers kijkend naar de andere kant van
de Schelde...
Vlaanderen PV-update
met nieuwe grafieken (7 februari 2011): Nieuw type grafieken voor
de statistische analyse van de Vlaamse zonnestroom afzet markt.
Update
Vlaanderen PV-markt - voorlopig 2010 320,1 MWp nieuwe registraties bij
VREG (24 januari 2011): Met extrapolatie grafiek om te bepalen wanneer
Vlaanderen 1 GW aan omvormer capaciteit voor zonnestroom kan hebben bereikt.
Marktgroei NL,
VL, BRD - zo maar wat leuke, en tale-telling PV cijfertjes (6 januari
2011): Vergelijking van drie onvergelijkbare zonnestroom afzet markten.
Kleine
eindejaars-rush Vlaanderen (4 januari 2011): Definitieve degressie
voorstel voor verlagen van de waarde van groencertificaten voor zonnestroom
in Vlaanderen (interactieve grafiek). En veel te lage inschatting van
de afzet van nieuwe PV-capaciteit in 2010 in een artikel op Energeia.
Triodos pakt weer
vet uit bij financiering 2 MWp Vlaamse PV-centrale... (20 december
2010): Triodos Renewable Europe Fund financiert weer een grote PV centrale
op een logistiek centrum in Puurs, Vlaanderen.
Vlaanderen
zet nog steeds behoorlijk wat PV-capaciteit bij (13 december 2010):
Vlaanderen bereikt 100 Wp PV-capaciteit per hoofd van de bevolking.
Vlaamse
Regering past groencertificaten regeling aan (11 december 2010): Degressie
van de waarde van de groencertificaten voor zonnestroom alsnog besloten,
met kleine aanpassing. Interactieve degressie grafiek.
Freya
van den Bossche terug naar tekentafel in Vlaanderen (2 december 2010):
Slechts uitstel van executie: voortvarende minister die zonnestroom hard
af wilde knijpen in Vlaanderen moet voorlopig even pas op de plaats maken.
Geen
moord en brand bij zonnestroom in Vlaanderen (28 november 2010): Bij
de zuiderburen zijn ze minder boulevard-minded rond veiligheid van PV-installaties
- daar gaat de sector gewoon overleggen met de brandweer korpsen hoe risico's
voor het personeel te minimaliseren.
Groene
trammelant in het schone (?) Vlaamse land (26 november 2010): Begin
van het einde: Vlaamse regering gaat ingrijpen in de (veel te lucratieve)
incentive pyramide voor zonnestroom.
Vlaanderen
haalt weer verpletterend uit: 68,3 MWp nieuwe registraties bij VREG in
juli (8 augustus 2010): Met tale-telling video-still van "een
van de heftige aansluitingen" van het multi-site Katoen Natie Project
(totaal 40 MW zonnestroom capaciteit).
Voorspelbare
fraude in Vlaanderen bij jaarwissel groencertificaten waarde verlaging
(22 juli 2010): "Creatief omgaan" met de "overgangsregeling"
die van overheidswege was verzonnen om de bijbouw boom eind 2009 op te
vangen leidde tot voorspelbare "dubieuze praktijken".
Naar de
vuilnisbelt met die zonnepanelen! (18 juni 2010): Plannen voor zonnestroom
park met 9.800 PV modules op afval stortplaats bij Appels.
Volledige update
mei 2010 Vlaamse PV markt (15 juni 2010): Vlaanderen passeert met
gezwinde spoed de 400 MWp drempel en Polder PV past de statistiek pagina
aan.
Vlaanderen op
naar 350 MWp PV accumulatie (5 mei 2010, achtergronden van het zoveelste
PV-record bij de zuiderburen)
Kerstman strooit
rijkelijk met cadeau's bij de Vlamingen: PV naar ... 236 MWp (24 december
2009)
ASN en zonnestroom
II: 2,6 MWp project Willebroek (12 december 2009)
Tale-telling
VREG grafiek - Vlaanderen neemt definitief afscheid van Nederland
(10 december 2009)
Sjoemelen mag
- voor de ghoede saeck II. Met 40 MWp PV-moois (9 december 2009, Katoen
Natie pakt grootschalig uit met PV)
Sjoemelen mag
- voor de ghoede saeck I (9 december 2009, "overgangsmaatregel"
45 >> 35 eurocent/kWh)
Meest
geplaatste module types België cf. Sonnenertrag (11 november
2009)
Je
kunt ook overdrijven... (10 november 2009, Vlaamse ondernemers willen
ook het Duitse EEG...)
Vlaanderen:
geen "injectietarief" PV-bezitters, ook voor andere DE-opties
overwogen (3 november 2009)
Andere
buurman pruttelt verder: Vlaanderen plaatst september 18 MWp bij (7
oktober 2009)
Vlaanderen
verplettert Nederland met zonnestroom: > 122 MegaWattpiek geïnstalleerd.
(18 augustus 2009)
Progressie
PV Nederland en Vlaanderen (6 juli 2009)
Waar een wil is is een
weg (7 juni 2009, met ook enkele data voor Wallonië)
Zonnestroom in
Vlaanderen groeit lekker verder: 90,8 MWp (7 mei 2009)
Keerzijde
van het (Vlaamse) PV succes (29 april 2009)
"Het"
is geschied: Vlaanderen is Nederland voorbij gescheurd (9 april 2009)
Tale telling passage
(22 maart 2009)
CBS velt "het
oordeel" over PV-Nederland, Vlaanderen rukt razendsnel op (3
december 2008)
Belgische
PV-markt groeit snoeihard (29 augustus 2008)
Lieven Lefebvre:
dikke "hollandsche" PV-installatie (17 juni 2008)
Oh la la... (18 maart
2008)
Such is the
incredible power of a feed-in tariff... (11 oktober 2007)
Vlaanderen
op weg naar record PV-jaar (26 februari 2007)
Inspiratie opdoen bij de zuiderburen
(19 oktober 2005, begin van de "revolutie")
... en een snuifje Wallonië
Solaire Ardennoise (13 oktober 2008)
Segaar, P.J. (2012). Belgium’s 2011 PV market beats previous record year 2009: 687 MW, with more still in the pipeline - SolarPlaza / The Solar Future Belgium '12 (March 6, 2012). Electronic publication (summary of present web page, update). See also pdf.
Segaar, P.J. (2011). Belgian Solar Market Cooling Down Following End of 2009 Boom. - SolarPlaza (March 1, 2011). Electronic publication (summary of present web page, update of Walloon and Brussels region). See also pdf.
Hirshman, W.P. & Podewils, C. (2011). Flandern will Vergütung kürzen. - Photon 1/2011: p. 13.
Hirshman, W.P. (2010). Gedämpfte Erwartungen. Belgien legte 2009 bei der Photovoltaikleistung gewaltig zu - nun ist ein Dämpfer programmiert. - Photon 9/2010: pp. 17-18.
Segaar, P.J. (2010). Flanders leading the way in Belgium with photovoltaics. - SolarPlaza (April 1, 2010). Electronic publication (summary of present web page). See also pdf.
Podewils, C. (2009). Boom-boom Belgien. Warum die Solarmärkte in Flandern und in der Wallonie um 100 Prozent jährlich wachsen. - Photon 6/2009: pp. 24-26.
Köpke, R. (2007). "A lot will happen here". The Belgian solar market is considered promising - especially when looking at the potential of the PV industry. - Photon International 3/2007: pp. 20-53 (landen special).
Relevante organisaties: ODE België, Vlaams Energie Agentschap, VREG. Voor Wallonië: "Portail de l'énergie en Région wallonne", certificatie instantie CWAPE. Voor Brussel: Brugel, resp. Apere, "hernieuwbare energie in Brussel".
Overzicht
van alle organisaties die met (hernieuwbare) energie van doen hebben in
België:
http://www.brugel.be/Public/Menu.php?ID=12&siteID=2&language=dut
EurObserv'ER
rapport 2008 met (verwachte) marktdata voor (o.a.) België in de jaren
2007-2008 downloaden van:
http://www.eurobserv-er.org/downloads.asp
PV
in Vlaanderen:
http://www.photon.de/news_archiv/details.aspx?cat=News_Archiv&sub=Politik&pub=1&parent=2755
(17 september 2010, fors afwijkende getallen voor de bijbouw in België
cq. Vlaanderen, waarschijnlijk door de eind tot eind februari 2010 pas
"officieel" aan het net gegane PV-systemen nog bij 2009 te rekenen;
Duitstalig artikel)
http://www.ode.be/index.php?page=elec-uit-zon-markt
(marktontwikkeling Vlaanderen tot en met 2007)
http://www.vreg.be/nl/06_sector/04_groenestroomproducenten/08_statistieken/04_groenestroom.asp
(meest actuele, uitgebreide detail data van de VREG, loopt echter soms
1-2 maanden achter wegens overwerkte administraties)
http://www.vreg.be/nl/06_sector/04_groenestroomproducenten/08_statistieken/01_rapporten.asp
(rapporten pagina van VREG met o.a. de jaarcijfers in de vorm van "Marktrapport
20##")
http://www2.vlaanderen.be/economie/energiesparen/milieuvriendelijke/TA0509PV.pdf
(pdf met artikel "Zonnepanelen scoren hoog", tevreden zonnestroom
klanten in België/Vlaanderen. Test Aankoop publicatie met enquête
onder 3.300 PV-systeem eigenaren)
PV
in Wallonië (incl. Duitse "enclave"):
http://energie.wallonie.be/fr/le-solaire-photovoltaique.html?IDC=6185
(zonnestroom in Wallonië)
http://www.cwape.be/xml/doc.xml?IDD=5701&IDC=107
(recentste aansluit gegevens voor "decentrale productie eenheden"
(waaronder de allergrootste bulk van PV-installaties) in Wallonië,
status 17 november 2009)
http://www.cwape.be/xml/themes.xml?IDC=1532
(overzicht van diverse rapportages over groene elektriciteit in Wallonië,
inclusief zonnestroom)
http://www.waalsweekblad.be/zonnepanelen.shtm
(Goede Nederlandstalige info over de financiële ondersteuning van
zonnestroom in het Waalse Gewest)
PV
in Brussel:
http://www.brugel.be/Files/media/ElecVerte/Lijst_installaties_2008.pdf?siteID=2
(lijst met grotere installaties gecertificeerd voor ontvangst groencertificaten,
met 5 PV-systemen)
http://www.brugel.be/Files/media/Rapport-Certificats-Verts-2008-v-1.1-NL.pdf
(verslag markt groenestroom certificaten Brussel tot en met 2008)
http://www.bruxelles-renouvelable.be/sites/default/files/hen20_Web_press.pdf
(samenvatting marktgroei PV in Brussel 2008 en verwachting voor 2009)
Franstalige
databases:
http://www.bdpv.fr/stat_departement.php
(zeer interessante, reeds ruim 4.000 PV-systemen [15,212 MWp] bevattende
particuliere database met als zwaartepunt Frankrijk [24 sep. 2009: 3.567
installaties], maar ook veel Belgische systemen: 480 stuks in Franstalig
België, 27 installaties in het autonome Bruxelles, en ook nog 19
exemplaren in drie Vlaamse provincies, ook klikbare kaart met alle installaties)
http://www.ef4.be/fr/getMOD/v/vID/425/modEND/pv-database/pv-database.html
(Franstalige database voor Wallonië en Brussel met [stand 22
sep. 2009] reeds 2.126 aangemelde, vaak enkele kWac grote particuliere
installaties, niet officieel)
Verder diverse bronnen in Belgische media, deels ook van Energeia.nl.
Webpagina voor het eerst opgemaakt dd. 22 september 2009, daarna indien mogelijk updates zodra nieuwe data bekend worden gemaakt
Update
historie:
7 oktober 2009; 24 december 2009;
2 februari 2010; 7 februari 2010 (volledige update rest van België); 11 februari 2010 (herziene update voor heel België/gewijzigde data voor Vlaanderen); 11 maart 2010 (update Vlaanderen tm. feb. 2010); 1 april 2010 (publicatie samenvatting van deze pagina op SolarPlaza.com); 5 mei 2010 (update Vlaanderen tm. apr. 2010); 15 juni 2010 (update Vlaanderen tm. mei 2010); 12 juli 2010 (update Vlaanderen tm. 29 juni 2010); 8 augustus 2010 (update Vlaanderen tm. 31 juli 2010, foto's Katoen Natie); 13 december 2010 (update Vl., foto Diepenbeek sluis);
23 januari 2011 (update Vlaanderen tm. 1 januari 2011); 31 maart 2011 (volledige update tm. 28 februari 2011 met enkele nieuwe grafieken, aanpassing alle VREG data: opgaves in AC vermogen); 27 april 2011 (update 5 apr. 2011, markt groei tabel 2011, foto Nyrstar project, en 2e grafiek Katoen Natie toegevoegd); 18 mei 2011 (update 2 mei 2011); 7 juli 2011 (update 1 juni 2011); 23 augustus 2011 (update 1 augustus 2011); 11 oktober 2011 (update 1 september 2011); 24 oktober 2011 (update 1 oktober 2011); 23 november 2011 (update 1 november 2011); 12 december 2011 (update 1 december 2011);
1 februari 2012 (update VREG 1 januari 2012; revisie gegevens Wallonië en Brussel); 19 februari 2012 (update VREG 1 februari 2012 en spreadsheet 6 februari 2012); 30 maart 2012 (update VREG 2 maart 2012 en spreadsheet 1 maart 2012); 28 september 2012 (update TIR centrum Brussel 1,6 >> 1,2 MWp);
10 februari 2013 (update Belgische markt en deelmarkten Apere: zie hier)
|