
PV
Weltmeister 2011
| |
|
||||||
|
PV
Weltmeister 2011 |
index | ||||||
|
|
|
|||||||||||||||||||||||||||||||||||
| NOTE! Most recent preliminary data published by Bundesnetzagentur on January 6, 2012 (2011 record year with 7,5 GWp). See article PPV January 10, 2012, with two graphs of capacity expansion. Detail data for Oct. up till Dec. 2011 will be published by BNA in March 2012. |
^^^ 2011 showed increasing, but - for Germany - "moderate" growth, with total volume for Jan. up till Sep. accounting for 3,4 GWp and 128.528 new installations. This is much lower than in world record year 2010 (5,5 GWp up till September, with 201.022 new installations). June has been the busiest month sofar in 2011, with 630 MWp of new installed capacity reported to BNA. This is far below world record month June 2010, when a staggering new volume of 2.109 MWp was reported (just before the long known degression as per July 1, 2010). With all known revisions by Bundesnetzagentur, 2010 saw a new world record market volume of 7.378 MWp (this used to be 7.408 MWp before the changes to the volumes for October up till December) and almost a quarter of a million new PV-installations (registered entries in the BNA spreadsheets, volume shown in brown column segments). Note, however, that the numbers for 2009 as well as for 2010 may change again in the EEG Statistik Bericht report expected March next year, since the ÜNB's have reported numbers of grid-connected installations deviating considerably from the numbers of BNA for these years. This graph has, however, been constructed from the last updated, detailed data available from Bundesnetzagentur for the period 2009-2011. If numbers change, they will be included in further updates in this graph on Polder PV. With the new and revised monthly installations, total accumulated German PV-capacity has broken the 15 GWp barrier in September 2010, and surpassed 17 GWp end of December of that year. The 20 GWp barrier has been surpassed with the August 2011 data provided by Bundesnetzagentur. That impressive volume has been reached in a relatively short time after breaking the "magic"10 GWp barrier (accumulation of grid-connected PV-systems) in January or February 2010, depending on the data source for accumulated MWp level in previous years. 2011 could probably take the 22 GWp hurdle in view of many reports on large-scale free-field installations meant to be finished before the 15% degression as per January 1, 2012. Graph
for Netherlands based on CBS (only once a year, 2010 year report
has been published September 8, 2011, and possibly a "final
revision" in November 2011), CertiQ data (monthly reports and/or
revised year reports), and preliminary StatLine data published on
June 30, 2011. The latter revealed a market growth of 20,4 MWp of
grid-connected installations in 2010, of which only 11 MWp appears
to have been realized under the so-called "innovative"
but tear-jerking national subsidy regime "SDE" (only 54%
of total grid-connected market realisation for that year...). |
Revision
of previous data published by Bundesnetzagentur (October 21, 2010)
(including two graphs)
Grafieken/Graphs BNA (PV-capacity Germany
2009-2011)
1. Capaciteit per maand/Capacity per month
2. Accumulatie capaciteit per Bundesland 2011/Accumulation
of capacity per Bundesland 2011
3. Verschil groei maandcapaciteit 2009-2011/Monthly capacity
growth differences 2009-2011
4. Accumulatie aantal installaties per Bundesland 2011/
Accumulation of number of installations per Bundesland 2011
5.
Verschil groei maandelijkse installaties 2009-2011/Monthly
installation growth differences 2009-2011
6. Groei per installatie categorie 2011/Growth per installation
category 2011
7. Aantallen en systeemgrootte per Bundesland 2011/Numbers
and system size per Bundesland 2011
8. Gemiddelde systeemgrootte per categorie 2011/Average
system size per category 2011
9. Groei per maand 2009-2011/Growth per month 2009-2011
10. Progressieve ontwikkeling van de PV-markt in Duitsland
in 2011/
Progressive development of Germany's PV market in 2011
11. Kwartaal overzichten 2009-2010/Quarterly reports
2009-2011
12. Grafieken
met BNA registraties per dag en per week/
Graphs with BNA registrations per day and per week
Photographs:
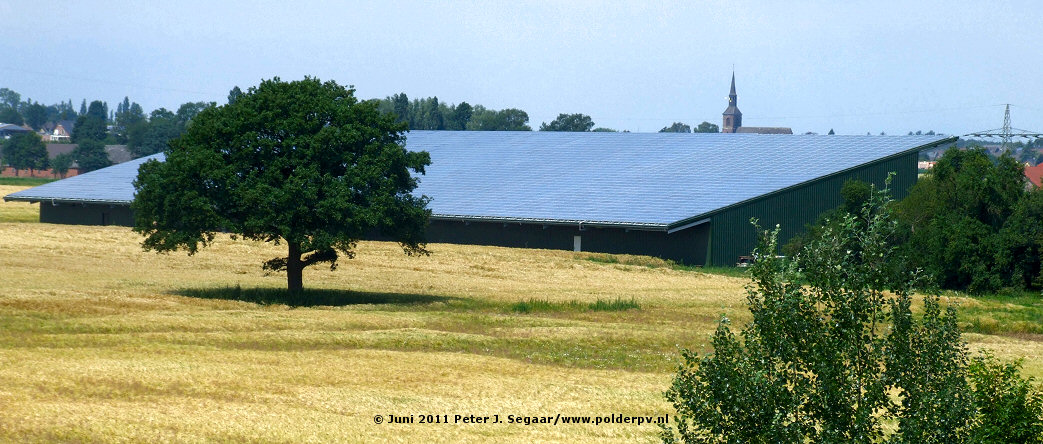
Wachtendonk-Kusen
typical gigantic shed with PV-roof, North-Rhine-Westfalia
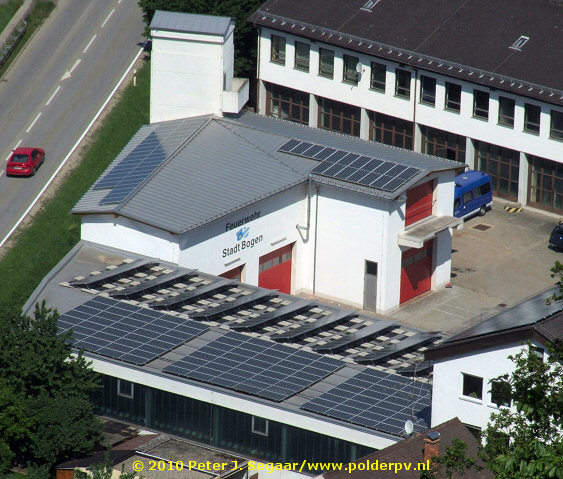
Bogen
firebrigade building, eastern Bavaria
Seenheim PV-village scene,
northern Bavaria
Gänsdorf-Straßkirchen
> 55 MWp solar parc, eastern Bavaria
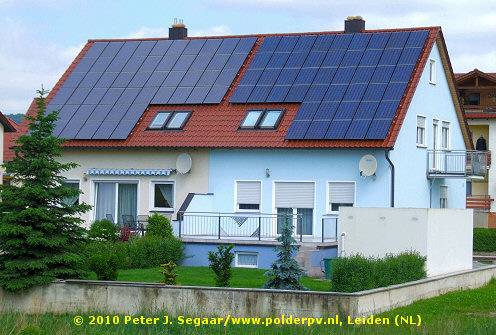
PV roof on "zweifamilien"
dwelling in Tegernheim, eastern Bavaria
Appartment complex with PV in Simbach,
SE Bavaria
Solarparc Rodenäs, Schleswig-Holstein
Ducking ostriches not allowed in PV-module
rich SW Bavarian Halden
Erlasee 12 MWp tracker field near Arnstein,
Bavaria
Further
PV-market analyses for Germany:
2012 2011 2010-II
2010-I 2009
2008 2007
def. 2007 cf. BSW 2006
2005
Op deze pagina een eerste inzage in de realisatie van zonnestroom in Duitsland in 2011, volgens cijfers van het BNA (Bundesnetzagentur), een ambtelijke organisatie onder het Bundeswirtschaftsministerium ("Economische Zaken van Duitsland"). Een groot deel van de opzet en basis informatie is ontleend aan de zeer gedetailleerde overzichten van voorgaande jaren (links hierboven) en aangepast daar waar recenter cijfermateriaal is gepubliceerd.
Update Capaciteit: BNA spreadsheet 2 november 2011 (update van 5 november op hun EEG statistiek web pagina). Juni tm. september 2011 - eerste officiële cijfers. Eerder waren al revisies van de maanden oktober 2010 tm. mei 2011 gepubliceerd met lichte bijstellingen (update 29 juni 2011). Deze wijzigingen zijn allemaal meegenomen in het huidige overzicht. Resultaten voorgaande periode (vanaf juni 2010):
Tweede helft 2010:
Juni-December
2010: 5.634 MWp (hele jaar: 7.378 MWp), 174.118 (hele jaar: 249.733) nieuwe
installaties aangemeld.
2011:
* Wereld maandrecord, het vorige record van 1.461 MWp verpletterend (December 2009, ook in Duitsland). December 2010 komt hiermee op de derde plaats qua nieuw volume (NB: voor Duitsland).
** Dat waren in mijn vorige berekening (toen de update voor die maand mij nog niet bekend was) nog "slechts" 492,9 MWp resp. 21.273 installaties, een zeer forse revisie dus. Volgens Photon 4/2011 mogelijk veroorzaakt door de haast die Bundesnetzagentur moest maken om op tijd, op 21 oktober 2010, het marktvolume voor de maanden juni-september te berekenen, op basis waarvan de nieuwe invoedingstarieven per 1 januari 2011 vastgesteld dienden te worden.
*** In een persbericht van Bundesnetzagentur van 16 juni 2011 werd gesteld dat er in de maanden maart tot en met mei 2011 ongeveer 700 MWp aan nieuwe zonnestroom capaciteit zou zijn aangemeld (laatste cijfers geven een volume van 717 MWp). Op basis van toen reeds bekende maandcijfers tm. april werd door mij afgeleid dat mei ongeveer 350 MWp nieuw zou moeten hebben opgeleverd. Het is dus zo'n 6% meer geworden (NB: nog steeds voorlopige cijfers). Zie ook mijn eerdere bespreking van 27 juni 2011.
**** Vanaf deze maand gereviseerde cijfers (of nieuwe data).
‡ Vanaf juni 2011 nieuwe maand data in updates van 2 november 2011. NB: de claim van Bundesnetzagentur op hun website dat er "664 MWp" zou zijn aangemeld in juni 2011 (vanaf 15 september tot en met begin november 2011 op hun website) is dus alweer met 34 MWp naar beneden bijgesteld. Dat is een "geskipt" maand volume waar we in Nederland maar wat blij mee zijn als we dat op jaarbasis er bij weten te plaatsen...
Uit bovenstaande volgt dat in totaal in zestien maanden tijd 8.991 MWp cq. 302.646 PV-installaties nieuw in Duitsland officieel is aangemeld. Een factor 90 maal de geaccumuleerde capaciteit die Nederland sinds eind negentiger jaren (grofweg in 15 jaar tijd) mogelijk zou kunnen hebben gerealiseerd tm. oktober 2011 (volgens laatste data incl. CBS StatLine gegevens: bijna 100 MWp, exclusief de onbekende, niet door CertiQ geregistreerde nieuwe installaties in 2011, met veel onzekerheden omkleed).
Voor 1 juli 2011 waren alweer nieuwe, marktgroei afhankelijke degressies aangekondigd, nota bene in samenspraak tussen brancheorganisatie BSW en het voor het EEG verantwoordelijke Duitse milieuministerie (BMU). Aangezien de inmiddels door BNA vastgestelde marktgroei in de "meetperiode" maart tm. mei 2011 is tegengevallen, is er per 1 juli 2011 i.t.t. de verwachtingen bij sommige marktanalisten geen nieuwe extra degressie ingevoerd.
De weliswaar lager dan in 2010, doch nog steeds enorme bijbouw volumes in Duitsland resulteerden in oktober 2011 al tot de vaststelling dat het met de PV-branche begin 2011 afgesproken "tweede" groeicorridor voor de bijbouw van okt. 2010 tm. sep. 2011 was overschreden, en dat per 1 januari 2012 er een degressie van 15% (9% plus twee maal een "straf percentage van 3%") voor alle nieuwe installaties in zal gaan.
Dat alles betekent dat, uitgaande van een invoedings-tarief van 28,74 eurocent/kWh voor installaties tm. 30 kWp per 1 januari 2011 (ververste tabel), met name de particuliere huishoudens met aankoop plannen voor een (meestal) dakvullend nieuw PV-systeem, vanaf 1 januari 2012 tot en met een eventule volgende degressie stap rekening moeten gaan houden met een wettelijk vastgelegde Einspeise Vergütung van 28,74 - (0,15*28,74) = 24,43 Eurocent/kWh, 20+ jaar lang. Dat begint al aardig in de buurt te komen van de consumentenprijs voor elektriciteit. Voor een pure groene stroom aanbieder als Lichtblick is de bruto consumenten prijs zelfs al 23,64 Eurocent/kWh (status 8 november 2011). Drie jaar geleden had je uitgelachen geworden als je had voorspeld dat net-pariteit in noordwest Europa (voor eindverbruikers) in 2011 al een realiteit zou worden...
Door de onder de prognoses liggende groei voor 2010 (er was aanvankelijk 9.500 MWp ingeschat door de Übertragungsnetzbetreiber), is de EEG Umlage van 3,53 Eurocent/kWh in 2011 slechts marginaal opgehoogd tot 3,592 Eurocent/kWh in 2012. Zie PPV analyse.
Duitsland zette er volgens deze deels al gereviseerde, deels nog steeds voorlopige cijfers in heel 2010 een spectaculair wereld record volume van 7,38 GWp bij, bestaande uit bijna een kwart miljoen nieuwe PV-installaties. 2011 zal met name in de laatste maanden weer een spannend jaar gaan worden. Het jaar begon goed met 266 MWp nieuwe capaciteit in januari, maar daarna bleef de groei - voor Duitse begrippen - op een bescheiden niveau. Als de markt uit zijn voegen gaat kraken (omdat de moduleprijzen nog verder zijn gedaald), kan het wederom spannend gaan worden in de Bondsdag.
 |
^^^ |
Update Productie: 23 september 2011. De Duitse hoogspannings-netbeheerders publiceerden hun productie data van hernieuwbare elektriciteit (die onder het EEG regime valt) voor 2010. De cijfers zijn verpletterend, met o.a. al 11,7 Terawattuur aan zonnestroom in de mix. Intro en uitgebreide grafische analyse door Polder PV.
Kort daarvoor werden al voorlopige cijfers gepubliceerd over het eerste half jaar van 2011: wederom prachtig nieuws, met 20,8% van de totale stroom consumptie in Duitsland al van puur hernieuwbare bronnen. 3,5% van de stroom consumptie zou in dat eerste half jaar van 2011 al uit zonnestroom bestaan, er was toen al 9,7 TWh uit PV-installaties geproduceerd... Bericht van 29 augustus 2011 op Polder PV.
Update: Spreadsheet June 27, 2011. May 2011 - first official data. Results of previous months (as of June 2010):
Second half of 2010:
June - December
2010: 5.634 MWp (whole year 7.378 MWp), 174.118 (whole year 249.733) new
PV-installations reported.
2011:
* World record in one month time, breaking the previous 1.461 MWp record by far (December 2009, also in Germany). December 2010, with its new capacity, has become the third-busiest month since BNA started publishing monthly updates as of January 1, 2009.
** In my previous calculation (when I was not yet aware of the new September 2010 update) the original data for September 2010 were 492,9 MWp, and 21.273 new installations, respectively. Hence, a considerable revision. According to Photon 4/2011 possibly resulting from the fact that Bundesnetzagentur had to publish the "artificially calculated" total market volume for 2010 on October 21, 2010. Based on the results in the months June-September of that year. The new feed-in tariffs to be fixed as of Jan. 1, 2011, depended on that calculation.
*** In a press communication by Bundesnetzagentur (June 16, 2011) it was claimed that in the months March, April and May only 700 MWp of new capacity had been reported (last available numbers report 717 MWp). Based on the already known previous month data up till April, it was assumed by Polder PV that in May app. 350 MWp would have been added. With the last available, still preliminary data this appears to have been 6% more. See also my comment (Dutch) on June 27, 2011.
In total, in these 16 months only 8.991 MWp, 302.646 new installations, were reported in Germany, a factor 90 times the accumulated capacity that has been possibly connected to the grid in the Netherlands since the nineties of the previous century (app. 15 years, 100 MWp according to latest data of October 2011, incl. 2010 CBS StatLine 2010 data, but exclusive of non-certified new installations. Exact volume remains enigmatic). This strong growth led to the highest "growth corridor" as fixed in the EEG Novelle 2010 text for Germany for the beginning of 2011 (13%). In October 2011 Bundesnetzagentur fixed the threshold for the start of 2012 and, due to strong growth in the period October 2010 up till September 2011, a 15% degression for new installations connected to the grid as of January 1, 2012, has been determined.
This means that, taking the original feed-in tariff of 28,74 Eurocent/kWh for installations up till 30 kWp (January 1 up till December 31, 2011) as a starting point, in particular the many German private households with plans to buy a (mostly roof-filling) PV-system as of January 1, 2012 will have to calculate with an "Einspeise Vergütung" (feed-in tariff) of 28,74 - (0,15*28,74) = 24,34 Eurocent/kWh, for 20+ years. That is not far away from the consumer price for electricity in Germany (various taxes, net costs and EEG Umlage included). A pure green electricity German retailer like Lichtblick already has a gross consumer price of 23,64 Eurocent/kWh (status November 8, 2011). Three years ago you would have been laughed at if you suggested that grid-parity (for end-consumers) in north-western Europe would already become a reality in 2011...
Since the (world record) growth of 2010 has been below the over-optimistic prognosis of 9.500 MWp by the high-voltage net managers (ÜNB's), and because of other factors, the ÜNB's have increased the famous EEG Umlage, the fee on top of almost everybody's electricity price per kWh, only very little: from 3,53 up till 3,592 Eurocent/kWh (+1,8%), to be paid as of January 1, 2012. See detailed analysis by PPV in Dutch.
According to the revised but still preliminary data published by Bundesnetzagentur Germany added a spectacular volume of 7,38 GWp in 2010, consisting of almost a quarter of a million new PV-installations... 2011 started with a good number: 266 MWp has been added in January of the new year. Growth was however, on a moderate level throughout the rest of the year. It remains to be seen if an end-of-year rally will once again waken German politicians, as has happened before.
For use of graphs, please contact webmaster of Polder PV. On this webpage, English explanations can be found directly below the graphs.
Update Production: September 23, 2011. The German high-voltage net managers published their year data for production of EEG-compliant renewable electricity in 2010. Numbers are again astonishing, with already 11,7 Terawatthours of solar electricity in the green mix. Introduction and extensive graphical analysis by Polder PV.
Just prior to those numbers, preliminary data were published for the first half year of 2011. Again, wonderful news, with already 20,8% of total electricity consumption in Germany from renewable sources. In that first half year of 2011 already 3,5% of electricity consumed would originate from photovoltaic installations on German soil: 9,7 TWh would have been produced in those six months. See report by Polder PV, dated August 29, 2011.
Important! Note that in all the graphs and captions on this web-page the "European" type of decimal/comma separation is being used. Hence, "2.000" reads as "two-thousand" (alternatively used anglosaxon notation: "2,000"). "7,25 kWp" reads as "seven point twenty-five kWp" (= 7.250 Wattpeak; anglosaxon notation: "7.25 kWp" or "7,250 Wp")! See also discussion on Wikipedia "Decimal Separator" (Polder PV never has used the "space" in long numbers, hence not "2 000 000", but "2.000.000" to indicate two million or 2 times ten power 6, 2 "mega").
Units to remember:
BNA
De cijfers voor de progressie in bij het Bundesnetzagentur aangemelde
zonnestroom capaciteit (MWp) voor 2010-2011 (een verplichting
sinds de EEG Novelle tot geldige Wet werd op 1 januari 2009, om aanspraak
op de wettelijke invoedingstarieven te kunnen maken) worden door de bank
genomen een stuk sneller gepubliceerd dan die voor het eerste "verplichte"
jaar, 2009, al moesten we weer vrij lang wachten op de resultaten voor
juni-september 2011. Het gaat om omvangrijke spreadsheets van enkele megabytes
met soms vele tienduizenden entries waar mogelijk (deels) nog
steeds fouten (dubbeltellingen of wellicht netaansluitings-meldingen die
per ongeluk niet in de gepubliceerde lijsten voorkomen) in zitten.
Dit laatste blijkt gezien de correcties van BNA (EEG-Statistik rapport 2009) in eerste instantie behoorlijk mee te vallen voor dat jaar. Wel is er een aanzienlijke correctie van de oorspronkelijke voor september 2010 gepubliceerde cijfers geweest (zie verderop). Het valt nog te bezien hoe de bevonden verschuiving in capaciteit aan het net gekoppeld tussen de jaren 2009-2010, zoals gesignaleerd door de hoogspannings-netbeheerders, straks in het EEG Statistikbericht voor 2010 zal gaan uitpakken (verwacht pas in maart 2012).
De grafieken op deze pagina zijn voor het grootste deel gebaseerd op de reeds gepubliceerde niet-definitieve, of reeds al grotendeels in eerste instantie gecorrigeerde lijsten van het BNA. Indien er gecorrigeerde jaar rapportages met nieuwe cijfers komen, zullen deze worden verwerkt als daar tijd toe gevonden kan worden.
Ter informatie van Polder PV's Engelstalige lezers is de rest van de tekst in de Engelse taal gesteld.
 |
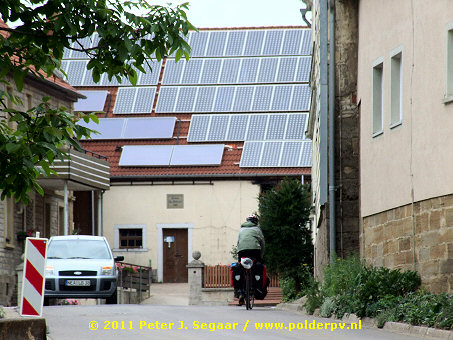
^^^ Germany is the place to be if you love solar electricity, or if you want to invest your well-earned money in a future-oriented, safe and sustainable venture. Many people, organisations, and companies fill their roofs and participate in the decentralized energy revolution in an unprecedented and widespread manner. With hundreds of thousands of participants (BSW Solar branche organisation claimed around 840.000 installations in a January 2011 update on their website). Photo taken during the 5-day, 610 km. long "Mega-PV Bayern III" sustainable bicycle tour between Regensburg and München, by the webmaster of Polder PV. |
Revision of previous data published by Bundesnetzagentur (October 21, 2010 and later revisions)
At the same time that the September 2010 data were published for the first time by Bundesnetzagentur (BNA), they also put revisions of previously published month reports on their website. The data for January 2009 (start of BNA registrations for PV-installations) up till September 2009 have remained unchanged. But as of October 2009, almost all previous monthly data were revised in that publication. The changes originally were not huge, and had only a slight impact on total volumes and capacities realised. The September 2010 revision, however, showed that considerable volume has been added to the original registrations. In addition, later revisions of earlier published data have already been published, and will probably be added in course of time. The changes with respect to the original publications can be seen in the graphs pictured below, made by Polder PV from the revised BNA data known at the date of the present update. The latest revisions have been published on June 29, 2011 (revisions for October 2010 up till May 2011).
![]()
Absolute changes in monthly data for registered PV installation numbers and accumulated capacity per month in the October 21, 2010 reports and following revisions. With respect to numbers, the biggest change originally was evident for record month June 2010, with 354 installations less than in the original report (refer to right Y-axis and orange columns). Looking at total capacity, columns in blue, and with data added in blue (data for number of installations omitted for clarity), in the same month 17,2 MWp disappeared from the original BNA records (left Y-axis). On the other hand, an increase of 10,4 MWp was recorded for May 2010: 294 new installations.
With the September 2010 revision, however, new dimensions had to be considered for this graph. Capacity has been changed from 492,9 MWp up to a new amount of 654,4 MWp, a staggering increase of 161,5 MWp (almost 33%)! For installations, increase was a formidable 6.570 new installations not previously published by BNA (number rising from 21.273 up till 27.843). The reason for these huge differences is not known (Photon attributed them to time-pressure for publishing first results as required by law).
Changes after that huge September 2010 correction have not been big, December 2010 being a "negative outlier" with a correction of 30,5 MWp less than originally published. And May 2011 with 8,3 MWp added in the June 29, 2011 correction with respect to the first publication of June 27, 2011 (two days earlier, at the same day corrections for previously reported data for October 2010 up till April 2011 were published).
The same graph as depicted above, but now relative changes are shown in percentage of the new or omitted installations with respect to the previous recorded data for installation numbers (orange columns, brown data), and total MWp capacities recorded by BNA (light blue columns, dark blue data). Note that not more than 1-2% deviation has been recorded in the new datasets for the reported volumes up till August 2010. The overall picture was that only 0,1% change with respect to total volumes and capacities newly added in the period 2009 up till November 2010 resulted from the revised BNA data.
This has changed dramatically with the revised September 2010 data: the new report revealed an enormous increase of up till 33% for capacity, and 31% for number of installations. Later still, deviations were almost negligable or at the most 2,5-2,6%, with positive as well as negative trends with respect to the original data.
Taking all changes from the revised data together, total capacity rose from 12,14 GWp down to 12,26 GWp for the period January 2009 up till May 2011 (an increase of 1,0%). 6.745 new installations were reported in the revisions in that period (32 installations less in 2009, 6.260 more in 2010, and 517 extra in 2011 up till May). It is expected that more revisions will be published by BNA. In addition, significant corrections may also be published later in the final reports of the "EEG Statistik" series. The next report is expected in Spring 2012, with, for the first time, completely revised data for 2010.
Graphs made from BNA data/Grafieken gemaakt van BNA data. UPDATE: September 2011 (including revision of previous data)
Basic spreadsheet June-September 2011 date-stamped November 2, 2011 (plus corrections October 2010 - May 2011 added date-stamped June 29, 2011).
All raw data
in this section from Bundesnetzagentur (FRG) unless stated otherwise.
Graphs made by Peter J. Segaar/Polder
PV, Leiden (Netherlands).
New capacity
per month
Nieuwe capaciteit per maand
Graph BNA 1 - Newly added nominal photovoltaic (DC) capacity per month (MWp, left Y-axis) in Germany in the period 2009-2011 (up till September 2011, including earlier published month revisions up till May 2011). Growth has been absolutely unprecedented for a long time, even after the post December 2009 frenzy due to feed-in tariffs sinking 8-11% from the first of January 2010. Year accumulation from January up till December 2009 has been 3.802 MWp according to the revised BNA data. In 2010 up till now a spectacular new (world record) volume of 7.378 MWp has been recorded by BNA. January 2011, still deep in its winter sleep, started suprisingly with 266 MWp, including a lot of big projects. However, for the first time in two years, February 2011 revealed relatively "low" growth with only 101 MWp. After that, the market started growing again progressively, although not reaching the record 2010 levels.
Big
PV-installations
The impact on total installed capacity of PV-installations is partially
the result of many large solar power plants of 100-1.000 kWp or even larger
being reported. In the 2010
overview several of them have been highlighted. In the listing below
the revised month data have been taken as used.
December 2010 brought a large number of large new PV-installations, which is the result of the directives incorporated in the EEG 2010 Novelle that free-field installations having obtained a building permission as late as March 25, 2010 could apply for the pre-July 1, 2010 tariff if the installations were technically connected to the grid as late as December 31, 2010. This has resulted in a considerable number of large installations that were reported to BNA in this last month of the year. The 100 up till 1.000 kWp installation category was well represented with 1.129 entries (although December 2009 and June 2010 saw more in this category). 125 installations (or blocks of large PV-projects) sized between 1 and 5 MWp were reported (only June 2010 had more, 139). And a so far unprecedented 20 entries with a system size larger than 5 MWp. The largest installation (or: registered entry) reported in December 2010 was a 18,467 MWp free-field system in or near Brandenburg (in the state with the same name). 6 "Länder" had one or more of these >5 MWp monsters and/or segments of even larger parcs registered with BNA: Sachsen-Anhalt had 6, Brandenburg 6, Bayern (Bavaria) 5, and one each for Sachsen, Baden-Württemberg, and Schleswig-Holstein.
January 2011 also delivered a surprising number of big installations. In the 100 up till 1.000 kWp category 256 new entries were recorded, 24 entries between 1 and 5 MWp, and 7 over 5 MWp. However, the biggest installation, has apparently been "cut into three pieces", since in the record listing entries of 5.376, 9.824,7, and 10.917,4 kWp for the Ahrensfelde project close to the border of north-eastern Berlin, in Brandenburg, have been included. Taken together, these blocks would amount to a 26,1 MWp installation. It is most probably the "Berlin-Eiche" project that has been taken over by the Dutch developer Pfixx Solar. The developer claims, however, that the project would have been delivered in 2010, casting doubts on the exact moment that the sub-projects were made known with BNA (note that Jan. 1, 2011 13% extra degression of feed-in tariffs has occurred, the three subprojects have been date-stamped the 3rd of January 2011 in the BNA spreadsheet). In addition, the capacity mentioned by Pfixx is slightly higher: 26,4 MWp,
Four more big projects >5 MWp were published in the Jan. 2011 file: 7.448,4 kWp Kratsdorf (Thüringen), 6.364,8 kWp Wertheim (Baden-Württemberg), 6.092,24 kWp Nohra (Thüringen), and, finally, 5.391 Klanxbüll (Schleswig-Holstein).
February 2011 has been a relatively "tranquil" month with slightly less than 100 MWp of new installations. Of these, none had a size over 5 MWp, and only 5 had capacities between 1 and 5 MWp (3 of them in Sachsen, one in Sachsen-Anhalt, and one in Bavaria). 141 installations were found in the size category 100 up till 1.000 kWp.
March 2011 revealed 175 installations over 100 kWp, 6 of them bigger than 1 MWp and one of these, in Bad Lausick in east-German Sachsen, was reported with a size of 7.074,73 kWp.
In April 2011 180 installations sized over 100 kWp were reported, of which 10 were over 1 MWp. The biggest installation was a 7,153 MWp project in Wertheim (northeastern part of Baden-Württemberg). It is most probably one of several blocks of the 35 MWp Tauberlandpark - Ernsthof sub-project by Relatio, south of Wertheim (website), for which earlier separate entries were discovered in the BNA data. A fascinating project that has been visited by the webmaster of Polder PV in June 2011 (see photo of the high-voltage connection here).
May 2011 had already 289 entries >100 kWp, 14 bigger than 1 MWp, and three blocks over 5 MWp all attributed to a large "Heideblick" (most probably: free field) installation, with a total reported size of 16,23 MWp, in Brandenburg.
June 2011 revealed 647 installations or blocks of free field systems >100 kWp, 28 of them over 1 MWp, and 2 sized >5 MWp. The latter two, Jabel in Mecklenburg-Vorpommern, seemingly add up to an installation with a size of 14,17 MWp. However, there are two more entries for Jabel, together the four make up 17,32 MWp. Still, that installation most probably is surpassed by 5 blocks in Zerbst (Sachsen-Anhalt), an installation delivered by Q-Cells, that add up to a large installation size of 23,77 MWp (see also September!). Mixdorf in Brandenburg had 7 entries adding up to 12,10 MWp. The relative large volume of big installations in this month might be related to the threat of an extra degression per July 1, that, however, did not materialise (due to slow market growth in the first half of 2011).
July 2011. 574 installations >100 kWp, of which 28 were sized >1 MWp and 6 had a volume greater than 5 MWp. Brandenburg's Koßdorf was the largest installation with 19,09 MWp in three separate entries. With three more entries introduced in March, April, and May, Koßdorf could account for a total of 27,41 MWp. Another 18,75 MWp was put forward in a single entry for Klettwitz in the same state, and Turnow-Preilack added 17,97 MWp to push Brandenburg even further in the race to Germany's biggest photovoltaic power plant league. It should be pointed out that Mixdorf in the same state added four more entries with a total of 12,06 MWp which, together with the 7 entries added in June, could make this a 24,16 MWp plant.
August
2011 clearly has been a record breaker with large-sized installations,
which might be related to the fact that originally for free-field installations
extra time up till September 1 was given for realisation before a planned
feed-in tariff degression would be implemented. The degression (for "normal"
installations planned for July 1, 2011), however, did not materialise.
The project planners for the large-sized installations had probably their
planning already in place, and realised them within the original time-frame.
429 installations or -segments over 100 kWp were reported. 51 of them
were over 1 MWp in size. 20 segments or installations had capacities (far)
beyond 5 MWp. The largest ones were: 78,06 MWp Senftenberg
(4 portions). Further, 51,68 MWp Klettwitz (5 portions). Adding up the
July entry, Klettwitz now may have a size of 70,43 MWp. 30,13 MWp Wittstock
(5 portions), with another big entry in September adding up to 32,92 MWp
for this location. Further: 13,09 MWp Tutow (2 portions), with another
segment in September adding up to 14,64 MWp. And 11,23 MWp Heideblick
(2 portions). Together with previous 3 installation segments in May that
adds up to 27,46 MWp for Heideblick sofar. Note that apart from Tutow
(Mecklenburg-Vorpommern), all of the mentioned large PV-installations
are to be found in Brandenburg, as well as some other single-entries in
the >5 MWp category in the August overview.
September 2011 introduced another 353 installations >100
kWp, 46 of them larger than 1 MWp, and 7 over 5 MWp. Of these, three portions
were attributable to a 20,84 MWp installation in Wiefelstede in Niedersachsen.
4 further big projects were reported from Sachsen (2), and both one in
Sachsen-Anhalt and in Mecklenburg-Vorpommern. Note that also 7 new portions
for the large Zerbst project in Sachsen-Anhalt were introduced, totalling
23,28 MWp. With previous entries in June, Zerbst now has a total project
count of 44,73 MWp (addition of >1 MWp blocks in the 2011 listings)
in the Bundesnetzagentur listings. The project developers of Q-Cells claimed
having sold two solar parcs in Zerbst with a combined power rating of
46 MW (see project portfolio mentioned in my article on their huge Briest
project, November
5, 2011).
Jan.-Sep. 2011. Brandenburg is by far the biggest and highly succesfull implementer (probably better: "enabler") of large-sized PV-installations in 2011. In the category >1 MWp I counted 363,7 MWp of new installations (or: registrations) in this period. 74 of them were given in the BNA spreadsheets, distributed among 30 different project sites. Hence, a spectacular average for that category only of 12,12 MWp per location. Second is world champion PV-implementation Bayern with 118,0 MWp of project / parts sized >1 MWp. Third is Sachsen-Anhalt with 104,8 MWp.
Medium-sized
installations
For a true democratic type of decentralized electricity production, the
market segment up till 10 kWp is possibly the most important one, in particular
the installation size up till 5 kWp that may fit most family homes with
acceptable orientation and lay-out of the roof. A few hundred thousand
German households have already taken the important step to bring solar
panels on their roofs and become an active participant in, and co-carrier
of the decentralized renewable energy revolution. Besides, they represent
the backbone of the political force that is absolutely necessary to break
the immense power of the monopolistic energy companies (and the political
powers that profit from that unwelcome situation).
In the period January up till December 2010, 27.764 new installations with a size of 1-5 kWp were reported (including revised data, 11,1% of total installations). In addition, 78.687 PV-systems in the range >5-10 kWp were recorded (31,5% of total, installations 1-10 kWp include 42,6% of all PV-systems in that year). In January up till September 2011 the market segment of 1 up till 10 kWp has been 66.988 new installations (52,1% of total), and 422,3 MWp (12,6% of total). This has been particularly the result of strong growth of this important market segment since May of this year, as ever more households become aware of the fact that module prices have never been so low, and they are confronted with ever restrictive legislation related to the magnitude of the feed-in tariff (Einspeise Vergütung) applicable to their situation.
The industry must provide the means and the price to be able to sell as many of these "smaller" systems as possible, in particular because the EEG Umlage (fee on the electricity price paid by almost all German users) included in the kWh tariff already has risen from 2,047 up till 3,53 Eurocent/kWh in 2011, and has increased slightly further to a level of 3,592 Eurocent/kWh to be paid as of January 1, 2012. That may become a political liability if people "are made to believe" that would be an unacceptable financial burden, if they are not informed well on the huge financial compensations that the brilliantly designed EEG system have brought to Germany (e.g.: decreasing prices on the Leipziger electricity stock exchange, for photovoltaics already signalled on some summer days). For details of the new capacities and installation numbers, see the two graphs below.
 |
^^^ CLICK on graph for enlargement. Detail of number of installations progression per year per category, focussing on the smaller market segments up till 10 kWp (partly off-scale in the image). In particular the segment up till 5 kWp, fitting on many smaller houses in Germany, is important since it is the "barometer" of the most important public market segment (installation costs are most apparent with small system sizes. If something goes wrong at this level, social acceptance for the German EEG could erode fast. In Januari 2011 the level seemed to be OK, somewhat comparable to that in the same month in 2010. However, in the next three months levels remained (far) behind those of 2010. At last, May 2011 did even better than the same month in 2010, but only for the 1-5 kWp segment. In later months, growth has been relatively strong. |
 |
^^^ CLICK on graph for enlargement. Comparable graph as shown above, but now for accumulated capacity per year per category. Here, impact on total capacity is, of course much lower since many large installations eat away lots of MWp's. However, in 2010 capacity also grew strongly in the smaller market segment up till 5 kWp per installation. 2011 showed modest growth in the first two months, increasing afterwards (above 2009 level), but not reaching the high level shown in 2010. In later months the trend has been mixed (sometimes better than in record year 2010, sometimes less strong. But overall, this important market segment shows sustained and healthy growth. |
Smallest
installations
"Minute" installations up till 1 kWp, also reported
in previous years, appear at low levels in the 2011 month updates. In
Februari, 31 of such micro-installations were reported, with a peculiar
series of 26 identical installations of 1 kWp in Harsefeld in Niedersachsen
(one project of a few modules per roof on a row of houses?). Again, a
very unlikely entry of a "20 Wp" installation (Hohen Neuendorf,
Brandenburg), has been included in that month. In the period Jan. up till
September 2011, a total of 161 installations in this "micro-category"
were reported with an accumulated volume of 116,3 kWp.
Accumulation
of capacity per Bundesland 2011
Accumulatie capaciteit per Bundesland 2011
CLICK on
graph for enlargement
X-axis: MWp accumulated per Bundesland in 2011.
Capacity given in number is the cumulative capacity newly installed since
Jan. 1, 2011 per Bundesland.
New capacity for Germany has been 459,7 MWp in September 2011, the first
9 months of that year an accumulated
total of 3.357 MWp has been added.
Graph BNA 2 - Accumulation of new 2011 PV-capacity in Germany split into the contributions of the different Bundesländer (the so-called city states of Berlin, Bremen and Hamburg included). Each month will be given its own colour code. Constant good growth in Bavaria/Bayern with 871,0 MWp of new installations up till September 2011, with the big surprise, east-German state Brandenburg, on second place (416,1 MWp) due to its strong increase resulting from many huge free-field installations. Baden-Württemberg follows with less than half of the volume of Bayern (403,2 MWp), not much more than Nordrhein-Westfalen (373,5 MWp), that is closely followed by Niedersachsen (342,4 MWp). It will be interesting to see final development of new capacities in the different Bundesländer in - again - one of the most exciting "solar" years for (still not beaten) world champion Germany.
Monthly
capacity growth differences 2009-2011
Verschil groei maandcapaciteit 2009-2011
Graph BNA 3 - Accumulation of new PV-capacity reported to BNA for eacht month of 2009 up till September 2011 (order of columns in each triplet from left to right). The columns represent stacks of 10 installation categories (unity: kWp) distinguished by Polder PV, as extracted from the rough (revised) BNA data. Development is heterogeneous and is strongly linked to the changes in financial incentives for new installations ("Einspeise Vergütung"), often stimulating installation "booms" just prior to a new degression marker (blue dashed lines). In particular the July 1, 2010 degression, long-time ahead expected, has led to a phenomenal new installed capacity of 2,1 GWp in June 2010. Another typical effect is a strong presence of very large installations in the months just prior to such a degression marker (black column segment, installations larger than 5 MWp each). That has been particularly so for December 2010, the last chance for big free-field installations on agricultural land to apply for the lucrative pre-July-2010 feed-in tariffs if a building permit had already been acquired in Spring of that year. Surprisingly, January 2011 also showed a conspicuous presence of this large PV-system category. It is possibly that this is related to the fact that December 2010 has been an exceptionally cold, and snow-rich month, and that part of the planned big free field installations planned to be delivered in that month, could not be realized in time. Those installations, completed and/or reported to Bundesnetzagentur in January 2011, will receive a feed-in tariff that is 13% lower than for installations that were connected to the grid just in time at the end of December 2010.
Surprising, August 2011 also showed very strong growth of this "utility scale" market segment. It is an illustration of the enormous price fall of PV-modules that lure ever bigger investments in large-scale photovoltaics by a growing number of investment companies. These apparently are avoiding the increasing uncertainties in the soap-bubble legacy of the financial markets, and are looking for more "viable" and "substantial" investment opportunities. Photovoltaics is one of the most exciting endeavours they have encountered in times of economical turmoil...
The graph clearly shows the popularity of the 15-30 kWp category (orange; the highest segment of the "first staffel" in the German EEG Law, which includes all installations from 1 Wp up till 30 kWp). Also, the 100-1.000 kWp segment (including installations with a few hundred to a few thousand PV-modules) has grown rapidly (purple in the graphs).
October 2010 has been the first month that less capacity was added than in that month in the previous year, 2009 (note: preliminary results). Surprisingly, it was followed by November with the same "negative" trend compared to that month in the previous year. Even December 2010 has not brought the large volumes predicted by some, maybe partially the result of the very frosty conditions and a lot of snow and ice in that month. Still, with a volume of 1.144 MWp of new installations, 305 MWp less than the amount in the same month in 2009, December 2010 cannot be seen as a "lost" month in Germany's solar history.
The new year, 2011, started with a good volume of 266 MWp, although the level might have been similar to that in January 2010, if one does not include the installations larger than 5 MWp. February has been the "worst" month since March 2009, although still 100 MWp has been delivered. March, April and May saw increasing capacities, albeit at a level far below that in the previous year. August was the first month in a long series that, again, more capacity was added than in the same month in record year 2010. Even if the >5 MWp segment is not considered here, that month clearly had a better "performance". September, however, again had much less capacity added than in that "pre-feed-in-degression" month in 2010.
|
|
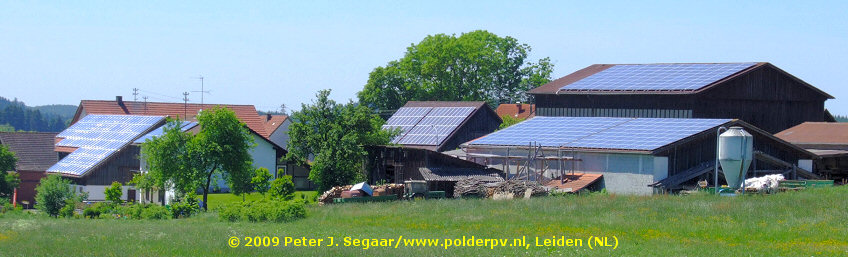
^^^ This particular PV-system is in Seenheim on the rim of the Naturpark Steigerwald in the north of Bavaria/Bayern. On the photo at least 48 monocrystalline modules are visible (many more were on the roof), and 6 thermal solar collector plates oriented in landscape. The village had many large roofs completely filled with PV-modules. |
Accumulation
of number of installations per Bundesland 2011
Accumulatie aantal installaties per Bundesland 2011
CLICK
on graph for enlargement
X-axis: number of new installations accumulated per Bundesland in 2011.
Numbers at the right end
of the bars represent cumulative new installations reported since Jan.
1 up till September 30, 2011, per Bundesland.
18.232
new installations were recorded for Germany in September 2011; the first
9 months of that year an accumulated total of 128.528 new PV-systems has
been added.
Graph BNA 4 - Comparable to Graph BNA 2, but again, in this graph with the number of installations reported to BNA split up per Bundesland. Bavaria taking the lead again with 41.025 new PV-installations. Note that, surprisingly, the rich and populous state of Nordrhein-Westfalen has replaced Baden-Württemberg (19.838) on the second place with 20.373 new installations up till September 2011 (while having a little bit lower accumulated capacity - Graph BNA 2 -. Hence, on average, smaller systems). Riddle: how many new installations will be added in 2011 in this wealthy world champion of solar fever?
"Reports of the death of the German solar industry have been greatly exaggerated." Recharge nr. 71(4)/June 4, 2010: p. 8. |
Monthly
installation growth differences 2009-2011
Verschil groei maandelijkse installaties 2009-2011
Graph BNA 5 - Accumulation of the number of new PV installations per month. Comparison of installations from 2009 up till September 2011 (order of columns in each triplet from left to right). Overall growth in 2010 has been much stronger than in the previous record year 2009, in particular in the first half year. Exceptions are August, and the final three months October up till December 2010 (note, however that total capacity reported for August still appeared to be larger than in August 2009, see Graph BNA3). June 2010 has been the most spectacular [reported] month in German (and, thus, world) photovoltaic history (up till now), with 65.062 new installations (revised data), six times as many as in the same month in 2009. With respect to the number of installations, the >5-10 kWp segment clearly is the most popular category closely followed by the >15-30 kWp market segment (highest feed-in tariff top segment).
September 2010, having been revised bij BNA in December 2010, used to be the third record month in German history, with 27.843 new installations. However, with the "possibly another degression threat" as per July 1, 2011, June 2011 has dethroned Sep. 2010 from that place of honour with 28.196 new PV-entries in the listings provided by Bundesnetzagentur.
Total number of 2010 installations "dwindled" to 12.435 in November, almost the same as the 12.527 new installations in October 2010. Still, with 415 new PV-systems a day "going strong". December 2010, although notably lower than in 2009, possibly due to the very frosty conditions with lots of snow, still showed 23.749 new installations, or 766 on average each day. Christmas included...
2011 saw only 5.598 new installations in January and therefore scored considerably less than the same month in the previous year (7.248 new systems, 23% less). February was even "dramatic" if German installation conditions are taken into consideration, with only 3.671 new installations. The lowest level since March 2009. Although the numbers increased again in March up till June, this clearly is a signal that Germany's top market is cooling off. Not surprising in the light of a series of drastic political measures to put a brake on the decade-long excellent market conditions. It remains to be seen how the precarious balance between ever lower system prices and aggressive cuts in the feed-in tariffs for new installations (13% as of Jan. 1, 2011, and another hefty 15% as of Jan. 1, 2012) will have impacted the PV-installation frenzy in world's largest solar economy in the final month reports by Bundesnetzagentur. For impact on growth of the smaller systems for households, see separate figure.
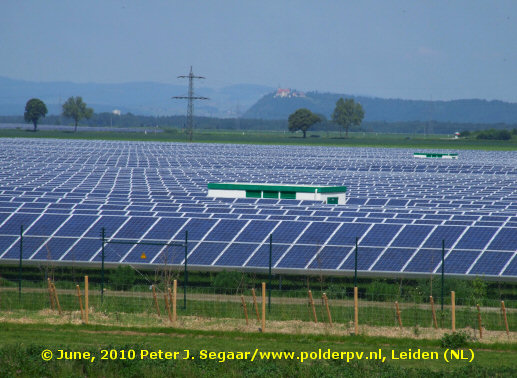 |
^^^ Installation details according to Krinner, the foundation provider/builder with its headquarters nearby: 54,5 MWp** total installed capacity, ca. 51.700 foundation screws, ca. 243.900 multicrystalline modules (average "size" app. 223 Wp), specially made using cells from Thalheim (Sachsen-Anhalt) based Q-Cells (modules made in China). The famous cell company that lost a serious amount of money in 2009, and that has undertaken drastic reorganisation measures to make the business profitable and future-resistent again. At least part of the parc has smaller SMA string inverters (as witnessed by the webmaster of Polder PV), but a big part of the huge power plant appears to have large inverter stations (Xantrex, daughter company of Schneider Electric). Construction period of this monster parc: approximately 3 months. Photo taken during the 5-day, 610 km. long "Mega-PV Bayern III" sustainable bicycle tour by the webmaster of Polder PV between Regensburg and München, visiting several MWp solar parcs and passing an uncountable amount of solar modules on his way through the beautiful Bavarian landscape. Of course, PV-modules, wind turbines and biogas installations, all are an organic and sustainable part of that modern state north of the Alps in the south of Germany. *
With that size, it was already 1,5 MWp larger than juwi's 53
MWp Lieberose parc delivered end of 2009, in east-German Brandenburg...
© 2010 Peter J. Segaar/Polder PV |
Growth
per installation category 2011
Groei per installatie categorie 2011
Graph BNA 6 - Status September 2011 - system size segmentation. Number of installations per selected installation size class (kWp) newly registered by BNA (since Jan. 1, 2011) in blue (scale at right Y-axis). In addition, MWp capacity cumulated in the same categories in yellow (scale at left Y-axis). As usual, the 5-10 kWp installation size segment is most popular with 47.418 new installations in the first 9 months of 2011. Followed by the 15-30 kWp market segment, the "premium" part of the highest feed-in tariff category (0-30 kWp), with 23.875 installations in the period shown. However, when it comes to impact on total new capacity installed, the balance clearly lies in the right half of this graph. Most popular with respect to total MWp installed appears to be the 100 kWp up till 1 MWp market segment, with a volume of 682,81 MWp. Due to inclusion of some very large installations in the January, July, August and September 2011 reports, strong growth of the two largest classes occurred, over 386 MWp (1-5 MWp segment), and a staggering 410 MWp (installations and/or segments over 5 MWp), respectively. Note that the much smaller category of installations between 50 and 100 kWp has approximately the same level of impact (392 MWp).
 |
^^^ Photo © Polder PV, taken at the start of Mega PV Radtour Bayern III, a long multi-day cycle tour in the beautiful Bavarian landscape filled with many photovoltaic surprises, June 2010 (Regensburg to München). |
Numbers
and average system size per Bundesland 2011
Aantallen en gemiddelde systeemgrootte per Bundesland 2011
Graph BNA 7 - Graph showing accumulation of new installations per Bundesland in the first nine months of 2011 in green columns (left Y-axis), and the average installation size in that period, in "empty" columns with dark brown margins (right Y-axis). In particular the average system size can vary considerably, strongly depending on the activity with large free-field installations in the Bundesland under consideration. One such PV monster (and/or many larger roof-installations) reported to the BNA can lift the system average in that region considerably in a particular month. The next month that system average might drop again as no new large systems are reported.
Activity with large and middle-sized PV-installations is particularly striking in the East German states such as Brandenburg (leader par excellence) that is very actively pursuing - and facilitating the realisation of - large PV-plants, and Mecklenburg-Vorpommern bordering the "Ostsee" and Poland. Also other East-German Bundesländer like Sachsen-Anhalt, Sachsen, and Thüringen (central Germany) have high system sizes, but only few installations. The relatively sunny (and windy) state of Schleswig-Holstein is the only "west" German Bundesland also having a relatively high system average.
Most striking is, of course, the average for Brandenburg. The state had only 2.660 new installations (actually: entries) in January-September 2011, but in particular since the large Ahrensfelde project has been included in January (26,1 MWp, almost 80% of total new volume in that month), and enormous additions were introduced in the autumn of 2011, average system size was totally off-balance in those months. It still determines a high system average when putting all months together, adding up to an average system size of a spectacular 156,4 kWp in the September accumulation.
Note that Bavaria, with most installations as always, still has a high average system size: 21,2 kWp per new installation in 2011. All 41.025 of them (note again: on average).
Average
system size per category 2011
Gemiddelde systeemgrootte per categorie 2011
Graph BNA 8 - Average installation capacity per category split by Polder PV for the new installations in January - September 2011. Overall average accumulated system size has reached a level of 26,12 kWp in this period (moving average, last column). This still is slightly less (5%) than the average new installation size in this period in 2010 (27,53 kWp), but the difference is decreasing. The > 5.000 kWp category had 47 large "entries" reported by Bundesnetzagentur in these first 9 months of the year. For this segment, 24 different project sites could be identified. Some of them take up several separate entries in the BNA database. The largest sofar in 2011 is Senftenberg in Brandenburg, with 4 entries accumulating to a possible project size of 78 MWp. There is another app. 70 MWp project being built on that huge lignite extraction area (see site inventarisation by Polder PV, article published July 16, 2011). The trend to ever growing huge PV parcs in Germany is in particularly evident in east-German state Brandenburg.
Growth
per month 2010-2011
Groei per maand 2010-2011
Graph BNA 9 - In this graph, changes will be shown from month to month in a comparison of 2011 with respect to (monthly) growth in the previous record year 2010. The comparisons will be made for 3 data: new capacity (MWp) installed in the month under consideration (light blue, left of each triple column), new number of installations per month (blue, the middle one of each triple column), and average system size newly installed in that month (dark blue, right of each triple column). Growth 2010 > 2011 will be given in percentage of the growth volume (newly installed capacity, installation numbers or average) in 2010.
Growth has been mainly negative with respect to the record volumes newly reported in the previous year. January 2011 did not show very strong deviating capacity or number of installations in comparison with those in 2010, but in later months negative trends were more apparent, apart for new installations in May, with a slightly positive trend. One factor clearly stood out: average installation capacity has been bigger in the first months of 2011 compared with 2010. Most probably resulting from several large free-field PV-installations that were not delivered "in time" (with respect to the new feed-in tariffs as of January 1, 2011) in the bitter cold, and snow-rich December 2010. However, April up till July had, again, a (much) lower average system size than in these months in 2010, and in particular in May the trend has gone clearly in the direction of smaller-sized average PV-systems. This has resulted from a strong growth of small-sized installations, such as seen in Graph BNA5, and a relatively moderate growth of large-scale PV-systems.
Again, this trend has reversed after the holiday month July: large free-field installations were being finished in suprising numbers, and average installation size in 2011 increased rapidly with respect to the previous year. Even installation numbers slightly increased, to be attributed to growth of activity in the private home sector.
 |
^^^ Zonnepanelen op appartementencomplexen ingewikkeld?* Niet in Duitsland. De eigenaar kan gewoon de hele installatie aan laten sluiten op één Einspeisemeter die in zijn/haar eigendom kan zijn, en door een gecertificeerd installateur wordt de hele installatie gewoon direct op het laagspanningsnet aangesloten. De lokale netbeheerder dient vervolgens maandelijks (of bij overeenkomst met de decentrale producent: jaarlijks) de wettelijk verplichte Einspeise Vergütungen uit te betalen zonder vertragingstactieken. Simple as that: zo word je wereldkampioen implementatie. Als dit specifieke PV-systeem voor 1 juli in 2010 aangesloten had geweest had het waarschijnlijk, gezien de grootte**, aanspraak kunnen maken op 20 jaar lang invoeding ter waarde van 39,14 eurocent/kWh. Flat in Simbach am Inn aan de zuidrand van oostelijk Bayern. Ik kwam daar net via de brug uit Braunau am Inn aan de overzijde, Oostenrijk, waar ik in het korte stukje dat ik daar fietste geen een PV-paneel heb gezien. Echter, zodra ik de Inn langs reed aan de Duitse noordoever van die brede rivier, was het weer "Blau, Blau, Himmelsblau". En niet alleen in de lucht, maar vooral ook: op de daken... *
Zie
bespreking
Ymere project Energieker op 27 juni 2010. Foto © Polder PV, genomen tijdens Mega PV Radtour Bayern III, juni 2010 (Regensburg - München). |
Progressive
development of Germany's PV market in 2011
Progressieve ontwikkeling van de PV-markt in Duitsland in 2011
Graph BNA 10A - Progressive development of installed capacity of photovoltaic installations in Germany in 2011, extracted from the (revised) month reports published by Bundesnetzagentur. In green columns the new capacity per month in MWp (refer to left Y-axis for scale). In yellow with red numbers the accumulation of newly installed PV-capacity reported to BNA as of January 1, 2011 (refer to right Y-axis for scale).
CLICK
on graph for enlargement
Graph BNA 10B - Figure comparable to previous graph, this time showing progressive development of number of photovoltaic installations in Germany in 2011. In green absolute new numbers per month (refer to left Y-axis for scale), in yellow, with red numbers, the accumulation of these data for January - September 2011.
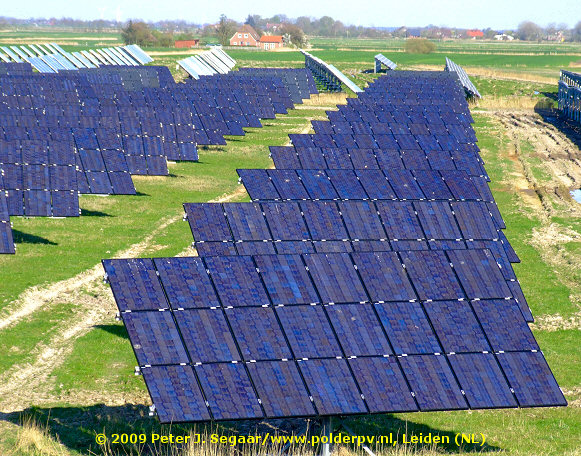 |
^^^ Regrettably, after long discussions and hot debates, German parliament decided that these so-called "free-field [FF] installations" are not allowed anymore when planned on agricultural land as of January 1, 2011 (effectively for planned PV-installations not having acquired a building permit in time: as of July 1, 2010). In other words: these type of (new) installations have been wiped from the EEG incentive regime (only FF installations on "conversion" terrains, restructuring areas, etc., can claim feed-in tariffs under the adjusted EEG 2010 Novelle). This will certainly put a brake on the progressive realisation of new capacities, and this questionable, politically motivated change discourages technological innovation and further cost reduction in the research field of this kind of large PV-installations. The "cheapest" of all PV-systems, if €/Wp system cost price and value of €/kWh produced is considered. Photograph
© 2009 Peter J. Segaar/Polder
PV |
Quarterly
reports 2009-2011
Kwartaal overzichten 2009-2011
Please note: quarterly overviews will be refreshed only as results of all months in the quarter considered have been published by Bundesnetzagentur. Next update is expected as soon as December 2011 results are known (quarter IV).
Noot: kwartaal overzichten zullen pas worden ververst als de resultaten van alle maanden in het betreffende kwartaal bekend zijn gemaakt door Bundesnetzagentur. Volgende update dus als resultaten voor december 2011 zijn gepubliceerd (kwartaal IV).
![]()
Graph BNA 11A - New PV-capacity registered by BNA per quarter (incl. revised data up till May 2011), comparison between 2009 (white columns), 2010 (brown columns), and 2011 (dark grey columns). The first quarter for 2010 already had 9,7 times more new capacity than reported in 2009, 2011 lagged behind 2010. The second quarter had 6,7 times as much new capacity, mainly the result from world record month June with 2,1 GWp of new capacity claimed. 2011 followed with app. 38% of that volume. In the third quarter, the ratio between 2009 and 2010 had dropped to a factor 1,8, due to the expected temporary "slack" in the market after the official start of EEG Novelle 2010 as of July 1 of that year (and despite the tempory rush in September). 2011 almost equalled growth of record year 2010, with only 2% less volume.
Contrary to previous thoughts, the final quarter in 2010 did not yield a record. Instead, the preliminary volume newly added was even less than that in 2009 (a year that showed ever more capacity in each new month, in strong contast to 2010). For 2010 as a whole, the "total" new capacity is, of course, much larger than in 2009 (final, dotted column pair): 7.378 MWp instead of the previous (2009) 3.802 MWp. 94% more newly installed capacity. An incredible growth rate, viewing the already huge market in Germany. It remains to be seen how 2011, after a "weak" first half year, will develop in its final quarter, in relation to the two previous years.
Graph BNA 11B - New PV-installation numbers registered by BNA per quarter, comparison between 2009, 2010 and 2011. The number of new installations reported in the first quarter of 2010 has been 5,4 times larger than that reported in 2009, 2011 showed slightly more than half of the numbers realised in 2010. In the second quarter the ratio 2010:2009 has been 4,2:1. For comparison: End of June 2010 only 4.693 certified PV-installations were registered with the Dutch bureau of CertiQ, only 4.077 of them newly added since April 2008 in a period of time that was 8 times as long as the first quarter of 2010 in which Germany added seven times as many brand-new PV-systems. If one counts the number of new systems added in the first 6 months of 2010 for Germany (140.677), 35 times as many certified installations were added in the world champion of photovoltaics as the Netherlands did in a period of 27 months time (April 2008 up till June 2010) under the umbrella of an exceptionally bureaucratic and highly capped "incentive" regime (SDE). This, in addition to an almost ten times bigger average installation size in Germany.
The third quarter has been considerably more quiet in 2010, showing only a factor 1,3:1 with respect to 2009 (and despite the rush in September). Quarte III in 2011 lagged behind that of 2010 less than 7%. The final quarter of 2010 did even worse than in 2009, in which the ratio 2010:2009 was decreased to 1:0,6. Still, for the whole year, 2010 has nothing to complain about. With almost a quarter of a million new PV-installations it crushed previous record year 2009 bij a factor of more than one and a half in system numbers.
![]()
Graph BNA 11C - Average size of new PV-systems registered by BNA in 2009, 2010 and 2011 per quarter. In the first quarter, average installation size has increased considerably from 13,0 kWp in 2009 to 23,4 kWp in 2010. This trend was further shown in the first quarter of 2011, reaching an average system size 2,5 times larger than in 2009 (32,86 kWp). The system average rose again to 18,1 kWp per installation in the second quarter of 2009, and even to a level of 28,5 kWp per installation in that period in 2010. 2011 showed a quiet second quarter with little progressive reports on larger free field installations.
Although the third quarter showed further increase of the system average in 2009 (up till 20,5 kWp), it remained stable in that period in 2010, possible reaching a temporary level of "saturation" or a system size that is hard to exceed on the roofs still available in Germany (at this average level: typical for farm roofs). With respect to the latter suggestion, only considerable module efficiency increases might bring further enhancement of average system size (taking into account an average roof surface available that does not change much). In that third quarter, it had already reached a very high level, far exceeding that realised in neighbouring countries (over 4 kWp/system in Flanders, Belgium, some 2-3 kWp/system in Netherlands). Still, the third quarter of 2011 brought another increase (to 29,19 kWp on average), which can be "blamed" upon the aggressive implementation of very large free field installations after the summer holidays...
The final quarter brought, however, for the time being, a new record level of 37,9 kWp per installation in 2010, far beyond the 28,1 kWp average reached in the final quarter of 2009. This is mainly the result of many very big installations coming on-line in, particularly, December 2010, just prior of the new tariff degressions as per January 1, 2011. It remains to be seen if that high level can be sustained for a long period. The number of locations for very big solar power plants will ultimately dwindle in Germany, in particular since the EEG Law has become terra non grata for such installations on former agricultural land (factually as of July 1, 2010). However, that moment has not yet arrived, and several big companies are building ever larger PV plants on conversion sites like lignite mine areas, other types of "brown fields", old military airfields, and the like...
 |
^^^ |
Both photographs © Polder PV, taken during Mega PV Radtour Bayern II, a multi-day cycle tour between Backnang in Baden-Württemberg and München (Bayern), May 2009.
Graphs with BNA registrations per day and per week
CLICK
on image for enlargement (click twice if necessary)
Status:
September 2011.
Graph includes all published BNA month revisions for data up till (and
included) May 2011.
Graphs BNA 12A (see also 4 details below) - Registered number of installations and total capacity per day at the Bundesnetzagentur office. All installations have a day-stamp in the Excel files produced by BNA. Clearly, the weekend interruptions can be seen in this graph (no or very little entries on weekend days). For four details of this graph, showing the end of June 2010, end of September 2010, and the December 2010/January 2011 reporting peaks, as well as the "false" June/July 2011 peak, see below. All registrations are lined up, starting from January 1, 2009 (beginning of EEG Novelle-dictated registrations at BNA) up till September 30, 2011 at the right of the X-axis. In blue-rimmed columns number of installations with scale on right Y-axis; in yellow filled columns total capacity registered on the day shown in kWp, scale on left Y-axis.
The huge "end of former interesting feed-in regime" rushes are clear even on a daily basis. For the end of 2009 December rush (due to law-derived degression percentages as of Jan. 1, 2010 8-11%) the pre-Christmas-day of December 23 had its record number of installations registered (2.939 entries), as well as with respect to total new capacity: 137,1 MWp on one day. The June 30, 2010 world record (442 MWp in one day) is shown in detail, below.
The third degression step in 2010, that of October 1 (3% extra degression for all new installations as of that date) showed only a relatively low peak at September 30, originally reporting 71,1 MWp by Bundesnetzagentur. However, in the December 23, 2010, update for September 2010, a large new volume was added and many installations, resulting in a considerable peak of 4.783 new installations on that day, with an accumulated volume of 162,3 MWp (128% more than originally published!).
Although the volumes for the snow-rich December 2010 month have appeared lower than expected, it is clear that the end of 2010 has resulted in a large number of big installations, as shown in the third detail graph further below.
Finally, a "false" peak appeared prior to a widely expected tariff degression as per July 1, 2011, part of planned law-enforcement by Germany's conservatives that even by Photon's high standards was considered as a so-called "Solarstromabwürgungsgesetz" (Law to strangle the market conditions for solar electricity). Due to slow market growth in Spring of that year, however, the degression was not implemented, as already predicted by Polder PV on June 27, 2011. However, that was not known at that time, and many investors, large and small, did not take the chance that their installations would fall in a lower feed-in category if they would have connected their PV-installations to the grid after that threatening first of July, 2011. For the effect, see the fourth detail graph.
June 2010 world record:
 |
^^^ A considerable number of installations (3.007 in the revised data by BNA) got a date-stamp "July 1, 2010", and will "have to do" with feed-in tariffs that are up till 13% lower than those fixed for 20+ years with the date-stamp "June 30, 2010". On weekend days (e.g., June 5-6, 12-13, etc.) no or very few registrations have materialised in the spreadsheets of BNA. The same applies to some holiday periods (eg., end of the year directly after Christmas and start of the new year, see overview shown above). ©
2010-2011 Peter J. Segaar/www.polderpv.nl |
The "end of June 2010" rush, triggered by the long awaited and hotly debated introduction of "EEG Novelle 2010" promising degression percentages of up till 16% (ultimately, however, materializing in max. 13% as of July 1, and an extra 3% as of October 1), has turned out to break the previous record to small pieces. On the very final day of the "old" tariff period, June 30, 2010, an enormous amount of 10.224 new entries were registered by BNA, with an unprecedented 441,8 MWp of capacity in 24 hours time. Most probably, a world record...
Although the number and size of the registrations have dropped considerably since that record day, a daily growth rate of 500 or even more installations with a capacity of approximately 25 MWp on average (temporarily rising again strongly end of September 2010) would be on every wish-list of any nation respecting itself and its sustainable future.
September 2010 rush (old versus new):
 |
^^^ Total new capacity for September 2010 has been upgraded to 654,4 MWp by BNA, originally that was only 492,9 MWp (a difference of 32,8%!). For installation numbers the difference has been 27.843 (new) instead of 21.273 (old), an increase of 30,9%. Note that in this graph the data shown for October 2010 have changed a little in the revised data available on the website of Bundesnetzagentur (revision date-stamped June 29, 2011, data shown in the over-all updated graph on top of this section). ©
2010-2011 Peter J. Segaar/www.polderpv.nl |
The second detail shows the originally considered "feeble" end of September 2010 rush in more detail. However, new data discovered in an apparent "old", cryptically named spreadsheet on the BNA website (separate tab "September 2010 aktualisiert") has made crystal clear, that there really has been a serious "end of September run" for reporting new installations to the BNA office. Instead of the originally reported 492,9 MWp, in the new version a much larger volume of 654,4 MWp has been recorded for this month. I emphasized the striking differences between the original and newer data by using the "rollover image" function that you can use by shifting the mouse pointer over and away from the image.
From this, it also became clear that, because of these huge changes for September 2010 (also in numbers, see figure caption), the preliminary data reported for the later months October up till December could also be revised with unexpected results. This, however, has had only very little effect in the later revisions published in the June 29, 2011 update on BNA's website. Hence, the expected "possible end-of-year-surprise" resulting from possible gross corrections of the October up till December 2010 data, did not materialize to the extent as those for September 2010. See also the quantified differences between original and revised data in the graphs published in the beginning of this analysis.
End of 2010 rush and start of 2011 with 13% degression:
 |
^^^ Many large installations have been reported in December, as they could apply for the "pre-July 1 feed-in tariff" if they had their building permit in time in March of that year. Many of these large free field installations have been connected to the grid in that last, icy, and snow-rich month. Even on the very last day of 2010, a considerable volume of 71,5 MWp was reported. The following weekend, the first two days of 2011, almost no new installations were included in the BNA spreadsheet. However, a big surprise reveals itself on Monday January 3, 2011: again a huge volume of 66,5 MWp has been reported with that date stamp. If these data are correct, it seems that at least 8 installations larger than 1 MWp (including the enormous Ahrensfelde/Eiche project of 26,1 MWp near Berlin), with a total volume of 42,2 MWp date-stamped on Jan. 3, 2011, have been unable to "technically deliver" their large free-field installations in time before the 13% degression was formally introduced in the EEG tariff system as per January 1, 2011. In the whole month of January 2011 (revised edition) even 102 MWp of >1 MWp installations or portions of larger parcs have been reported: all these will "enjoy" a much lower feed-in tariff for the coming 20 years. ©
2010-2011 Peter J. Segaar/www.polderpv.nl |
The
"false" degression-fear-related mid-2011 installation peak:
As indicated above, there has been a "false" installation
peak just prior to the expected (but abolished) extra feed-in tariff
degression planned for July 1, 2011. It did not happen because Bundesnetzagentur
calculated low growth for the Spring months, and the "gliding cap"
for such a degression was not reached. Still, because that conclusion
only became known end of June, many investors did not take their chances,
and installed prior to that "feared July 1, 2011". This is
the rather strong effect of that "politically induced fear in the
market place":
 |
^^^ Apparently the "message" that the extra degression step would not materialize already was understood by big investors prior to the feared date, since large scale installations were reported not long after the first of July, in particular on July 4, 5, and 13 (conspicuous yellow column peaks of 48,9, 42,5, and 33,2 MWp, respectively). Preparations had already been done long beforehand, the ultimate building of the project could be done at a slower pace, since June 30 was no hard "deadline" anymore to bring the hardware in connection to the grid. ©
2011 Peter J. Segaar/www.polderpv.nl |
As becomes apparent from the (detail) graphs shown above, the weekend "non-registrations" break up the continuous trend that should be apparent from normal daily entries as would be expected from the many thousands of new owners with PV-installations to report to the BNA office (the procedure is carried out electronically by most people and organisations claiming new PV-installations). To circumvent these "weekend holes" in the graphic representations, I summarized for each calender week the total number of entries (and capacities), and subsequently divided the outcome for each week by 7 to construct a new series of graphs with the "average daily entries per calender week" values, and without the "artificial weekend gaps". Three interesting graphs materialised from these calculations, such as given below.
Graph BNA 12B - Absolute number of installations registered by BNA (including revised data as of October 21, 2010) per calender week as of week number 1 in 2009. Five maxima are apparent, as could be expected from the important milestones, the (strongly politically motivated) new feed-in degressions for new installations reported (and the final, "not realised one", midway 2011). Starting with January 1, 2010 (5th day of calender week 53 of the previous year), the one with the biggest impact on July 1, 2010 (in the middle of calender week 26), the "extra" (actually: "postponed") 3% extra degression on October 1, 2010 (the middle of week 39). In addition, the end of 2010 rush prior to the new 13% degression as per Jan. 1, 2011. And finally, the "feared" July 1, 2011 degression date, that did not, however, materialise because of the "breathing cap" conditions for this degression step combined with the low market growth in Spring 2011. The milestones are indicated with vertical dashed blue lines indicating the hard (= realised) transition to a new tariff period for new installations. Therefore, no vertical line appears adjacent to the "false" peak of mid-2011. Please note that this peak has been even greater than the one for the true degression at the threshold of 2011-2011. Interesting food for thought for psycho-analists interested in "investor risk management"...
The actual week maximum for end of 2009 did not fall in the final week, but in week number 51 (December 14-20, 2009), with a record 11.249 new installations. The amounts recorded in the first calender week of 2010 abruptly sink to a still "interesting" level of 2.043 new entries, five times lower. Again, the final week of the first half year of 2010, week number 26 (actually running from June 28 up till July 4) breaks all records with 29.710 entries. Note that this is not the "7-consecutive-day-record": that has been of course the period June 24-30, with the "true record" of 32.263 new installations.
As of the beginning of September 2010 (app. calender week 35), installation numbers started increasing again up till the 30th of that month, recording 4.783 (prior to Sep. 2010 revision: 1.533) new installations on that final day (162,3 MWp instead of the earlier reported 71,1 MWp), prior to the new 3% degression valid as of October 1, 2010. Week 39 revealed 13.641 (before revision of Sep. 2010 data: 7.693) new installations: the "final policy decisions induced peak" of 2010, before the last one: that of the final days of the year.
The last calender week of 2010 (nr. 52) was not yet completed in the March 21, 2011 BNA update, later revisions finished the data for that year. In total, revisions gave a week total (7 days) of 7.188 new installations (the first two days of the new year were weekend days and only 24 new installations were recorded).
It is apparent that 2011 growth has been very low in the first two quarters in terms of what Germany has become accustomed to. However, the feared July 1 degression enticed the market once again, bringing week number 26 on a surprising mid-year high of 9.462 installations (week includes the first three days of July with 1.808 new entries). And after it became clear to market players that no further tariff cuts would materialise prior to the start of 2012, the market regained growth, helped in particular by enormous price cuts for even premium PV-modules during the year (grossly, global module price cuts could be summarized as app. 30% in 2010, another 20% in the first half year of 2011, and possibly another 15% in the second half year).
In the autumn of 2011, Germany seems to be able to keep a sustained level of connecting some 4.000 PV-installations on average to the grid. Per week (right portion of the graph above).
From the calculated week data, it is easy to obtain the average values per day for each week. I summarized two of these data in one graph, average number of registrations per day, and the average MWp registered per day for each week:
CLICK
on graph for enlargement
X-axis: Week number 2009-2011, updated up till week 39, September 2011.
Left Y-axis: average number of registered installations per day for
each week (yellow columns).
Right Y-axis: average installed capacity per day for each week (in MWp,
blue columns).
This and the previous graph is an excellent illustration of "policy-induced
reactive market development" of photovoltaics...
Graph BNA 12C - Although the graphs for the two values are highly reminiscent, they are not completely synchronous. This is particularly evident if total number of installations in a week is not exceptionally high, and relatively many very large installations have been reported in that week (height of blue column could have bigger impact than that of the yellow column for that week). Especially for the last weeks in 2009 and 2010, it is apparent that a considerable number of large installations have been reported, since the blue column for average system size surpasses that for number of installations in those weeks in the scale used here. It is clear that many large field installations have been registered with BNA in December 2010 (according to the revised data, among them 125 reported [parts of bigger] installations with sizes between 1 and 5 MWp, and even 20 larger than 5 MWp).
Note that, in addition to other changed data, the peak for the final week of September 2010 has become considerably higher compared to the values for the unrevised data for that month: the largest peak in week 39 now has 1.949 new installations on average per day (that used to be 1.099 in the unrevised version), and an average new capacity of 52,3 MWp per day (previous, unrevised version: 30,3 MWp). Almost double the previous data.
Also, the impressive number of very large free field entries in the August 2011 update, has considerable impact on the blue columns for that month: weeks 33 and 34 showed impressive, "non-feed-in-degression-related" average/day values of 21,8 and 24,2 MWp, respectively...
Finally, I was particularly interested into how the average overall system size developed in the course of time of installation reports entering the BNA statistics. This could easily be obtained from the data calculated for graph 12C:
Graph BNA 12D - X-axis shows year and week number (example: 09-36 = official week number 36 of 2009). Vertical blue lines are official feed-in degression dates (mostly stimulating policy-induced "just-prior-to-feed-in-degression-installation-rushes" by investors). As evident from this graph (updated with all the revised data and the last available month report for September 2011), average system size per calender week increased rapidly as of the start of 2009, and seemed to stabilise around 20 kWp average per installation (with exceptions in weeks with large free field installations reported). The end of 2009 rush resulted in week number 52 with an individual PV-system average of 42 kWp.
For the "end of June 2010 rush", the record value has been less impressive, although with 37 kWp on average in week 26 (including 4 days in "lower feed-in tariff period" July 2010) the Germans could be very satisfied. Note the surprising over 36 kWp average in week 34 of 2010 (August 23-29). This is the result of 10 installations >1 MWp registered in that week, with a total of 38,7 MWp, including two "blocks" in Finsterwalde, Brandenburg (5,6 MWp), a 4,4 MWp PV-system in Fuldatal, Hessen, and, in particular, the impressive 18,7 MWp installation in Thüngen, Bayern. Week nr. 47 (November 2010) also showed a high average, resulting from the inclusion of the Tutow 25,5 MWp plant (Nov. 23rd) as well as the Kloster-Lehnin 13,3 MWp system (Nov. 24th) in that same week.
The expectation that in the last month of the year 2010 many more large installations would be registered at the BNA office (last possibility to "score" a large installation with high pre-July feed-in-degression tariff...) has turned out to be true in a striking manner: a preliminary new average installation record had already materialized in week 52, with a spectacular average of 58,9 kWp per installation (note: including January 1-2 of 2011).
However, as mentioned above, the surprise came in the first week of January of the new year. Due to the "post-weekend" date-stamped entries (January 3rd, 2011) of 8 large free-field installations, combined with the fact that "only" 1.778 new installations were reported in week 1 of the new year, a surprising new average system record for that calendar week has emerged: 63,3 kWp per installation. Moreover, if we take the 7-day long period December 31, 2010 up till January 6, 2011, that "unofficial" week average even has been 70,9 kWp per entry...
After that record, number of new installations as well as large-sized free field systems dwindled, after temporarily reaching a new "week high" of 48,7 kWp in week 4 of the new year (January 24-30). A bottom value of 17,1 kWp was reached in week 19 (May 9-15). After that levels increased again. Reaching a new peak in week numbers 33 en 34, the latter topping at 45,9 kWp on average per installation reported to BNA for that week (August 22-28).
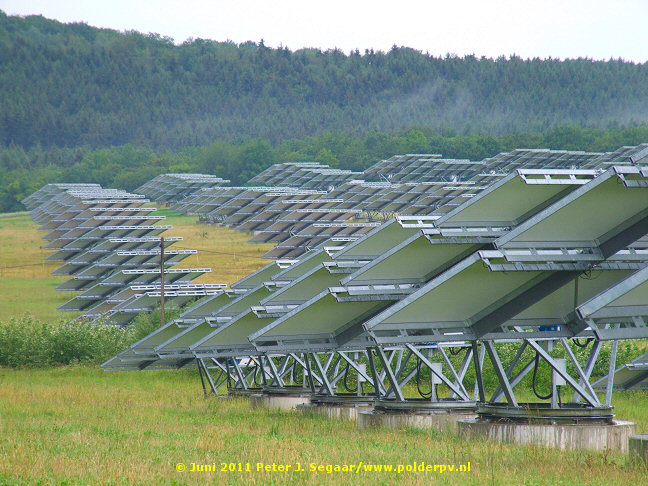 |
^^^ Most of the trackers in the Erlasee solar parc have large monocrystalline SOLON PV-modules, there is also a minority with multicrystalline solar panels. Some of the trackers, however, have specifically made modules with back-contact Sunpower monocrystalline cells (13 x 20 = 260 cells, nominal STC capacity 726 Wp! 12 modules = 8,72 kWp/tracker), and I have seen a few experimental trackers bearing modules with similar Sunpower cells and reflective aluminium ridges in between the rows of cells (13 x 12 = 156 cells, nominal STC capacity 475 Wp). The webmaster of Polder PV visited this fascinating and famous (for a short while world's "biggest") parc north of Bavarian Arnstein during his >1.600 kilometre long cycling trip between (German) Munich and the Dutch city of Roermond (Limburg), in June 2011. Surprisingly, a so-called Jugendzeltplatz (camping site for schools etc.) is in the very heart of the parc, near the buildings of the former winery on-site. Power To The People taken literally... |
(1) Internet newsletter of July 1, 2010, and article with images titled: "Photovoltaik in Deutschland vor dem Absturz." I recommend that article to anyone able to read German who is interested in the possible desastrous (???) consequences of "politically-motivated adjustments of world's most succesfull incentive regime" ever invented for solar electricity. SFV predicted a possible "Vollbremsung" (strong backlash) of the PV-market in Germany once the EEG Novelle 2010 would be effective. Although actual installation numbers and capacities indeed were considerably lower than in the record month June, the numbers for July and August remained staggering. SFV: http://www.sfv.de.
Statistical data:
©
Bundesverband
der Energie- und Wasserwirtschaft (BDEW)
© Bundesnetzagentur
(BNA)
Many studies with overwhelming details, numbers, and graphs, on developments with respect to the implementation of EEG Law and renewables in Germany can be found on the very well documented, unique site "Erneuerbare Energien" by the Ministry of Environment in Germany, BMU:
http://www.erneuerbare-energien.de/inhalt/
Voor de eerste data voor 2010: zie de Februari 2010 update BNA (jan. + feb. : plus 287 MWp nieuw) inclusief het accumulatie record (over de 10 GWp), en het inleidende bericht van 3 juli 2010.
Uitgebreide documentatie over de ontwikkelingen rond het EEG (inclusief zonnestroom) vindt u in de link lijst en referenties naar artikelen op Polder PV op de aparte EEG pagina.
"Ontdekkingsreis" van een contribuant op GoT Duurzame Energie: Erasmo fotografeerde "een straat vol zonnepanelen" vanaf de Duits-Nederlandse grens bij Winterswijk tot en met het 2,2 km. verderop gelegen Vreden in Nordrhein-Westfalen (post 4 juli 2011) en ging daarbij uit zijn dak: picasa fotoreportage. NB: "de lantarens zijn nog Winterswijk" (post). Symbolischer kan haast niet, die "Grüne Grenze"...
Uitwerking/additional calculations and graph production: Polder PV. Errors and miscalculations are the responsibility of Polder PV. Please notify the webmaster if you find any.
Webpagina published at May 14, 2011 (BNA report January 2011); update May 22, 2011 (BNA report February 2011), June 30, 2011 (BNA report March-April 2011), July 18, 2011 (BNA report May 2011), November 9, 2011 (BNA month reports June up till September 2011, and all revisions as of October 2010 up till May 2011).
|