|
|
                    
Weltmeister
generating green electricity
Update
August 2011¹
A deeper insight in Germany's renewable electricity market including photovoltaics,
in 2010
Meer
inzicht in de Duitse markt voor hernieuwbare elektriciteit incl. zonnestroom,
in 2010
¹
With
data from the Übertragungs-Netzbetreiber in Germany
Samenvatting
Renewable
electricity generation in Germany under the EEG Law
incentive regime: production results up till 2010
Grafieken/Graphs
1. Electricity production within and beyond
EEG legislation
2. Renewable electricity production per category (stacked)
3. Renewable electricity production per category: shares
in total consumption
4. Renewable electricity production per category (adjacent)
5. 100% diagram with shares per category in total renewable
EEG mix
6.
EEG electricity production (accumulated) and total electricity
consumption
7. EEG electricity production and YOY growth (%)
8. Average cost of EEG electricity (feed-in) and EEG Quote
9. Direct feed-in costs of EEG electricity components
and accumulated volume
10. Development of EEG Umlage (kWh fee for payment of
feed-in)
11. Shares of EEG electricity produced in four main grid
regions in BRD
12. Renewable electricity directly marketed beyond EEG
feed-in reach
Links
BRD
PV-marktanalyses
2012 2011
2010-II 2010-I
2009 2008
2007 def. 2007
cf. BSW 2006 2005
Samenvatting
Op deze
pagina worden in grafische vorm de resultaten gepresenteerd van de jaar
rapportages van de BDEW (Bundesverband der Energie- und Wasserwirtschaft),
die in Duitsland bij moet houden hoeveel hernieuwbare elektriciteit wordt
geproduceerd, aangevuld met de laatste gegevens (2010) die door de zogenaamde
ÜNB's moeten worden aangeleverd, de overkoepelende hoogspannings-netbeheerders.
Weer een ander ambtelijk instituut, het Bundesnetzagentur, houdt bij hoeveel
capaciteit aan zonnestroom systemen er in Duitsland bij worden gezet,
en houdt de vinger aan de pols van de netbewaking en talloze andere activiteiten,
met name gerelateerd aan de elektriciteitsmarkt. Voor de meest recente,
uitgebreid geïllustreerde overzichten van de Bundesnetzagentur data,
zie de separate webpagina's op Polder PV (2010
resp. 2011).
Wat de
energie opbrengst betreft, bereikte Duitsland eind 2010 een spectaculair
volume van 80,7 TWh hernieuwbare elektriciteit die onder de EEG condities
in de vorm van de bekende, langjarig vast uitgekeerde Einspeise Vergütungen
("feed-in tariffs") aan honderdduizenden decentrale opwekkers
werden uitbetaald. Op het totale binnenlandse stroomverbruik (485,5 TWh)
was het EEG aandeel al opgelopen tot 16,6% in dat jaar.
Windenergie had een teruglopend aandeel van 46,4% van alle EEG opties
(vooral vanwege het feit dat 2010 een slecht windjaar was), biomassa 31,2%,
en het snoeihard gegroeide marktsegment voor zonnestroom was al de derde
contribuant met 14,5% van het totaal aan opgewekte EEG stroom. Wat neerkomt
op maar liefst 2,41% van de totale stroom consumptie
in Duitsland in 2010... Er werd een record hoeveelheid fysiek bemeten
fotovoltaïsch opgewekte elektriciteit van 11,7 TWh vastgesteld in
dat jaar. Wat bijna evenveel is als de jaarproductie van drie Borssele
kernsplijters op maximaal vermogen.
Op deze
verder Engelstalige webpagina laat Polder PV in grafiekvorm diverse aspecten
van de door de hoofd-netbeheerders (ÜNB's) gepubliceerde cijfers
zien, en wordt uitgebreide uitleg onder de grafieken gepresenteerd.
Renewable
electricity generation in Germany under the EEG Law incentive regime:
production results up till 2010
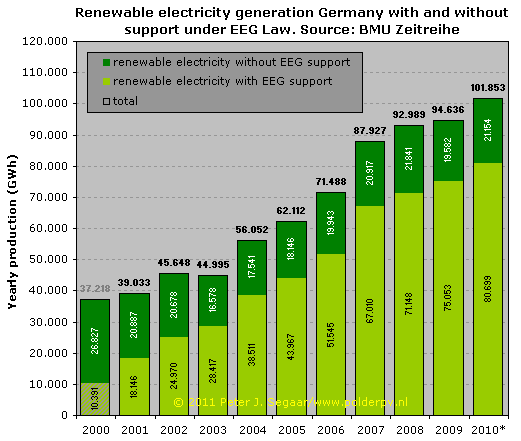
Fig.
1
This graph shows total volume of renewable electricity produced in Germany
in the period 2000-2010. The dark green top segments of the columns show
the electricity that is not covered by the renewable
electricity law (EEG - Erneuerbares Energien Gesetz) implemented in April
2000. The large, still strongly growing lower parts of the columns in
light green are covered under the EEG Law, and all feed-in eligible is
paid for by the net managers. The large accumulated sums of feed-in payments
are sold in priority on the Leipziger Strombörse, after which the
remaining sum of money needed is renumerated from the electricity bills
of almost all Germans via a complicated, but brilliantly designed administrative
mechanism. One of the many advantages of that system is that investors
large and small willing to build renewable electricity producing installations,
as well as the ultimate financers of the feed-in (the electricity consuming
Germans themselves) are not confronted with all kinds of administrative
nonsense. All procedures, calculations, and financial administrative work
is being carried out on the background by the net managers, the ÜNB's
(high voltage network administrators), and controlled by several administrative
bodies. It is the core of the success story of German's Green Electricity
Revolution.
Note
that the EEG officially has been launched on April 1, 2000. Hence, the
production result under the EEG umbrella (hatched column segment) is not
representative for a full calender year. The production in the first three
months of 2000 has been allocated to the "non-EEG" renewable
portion.
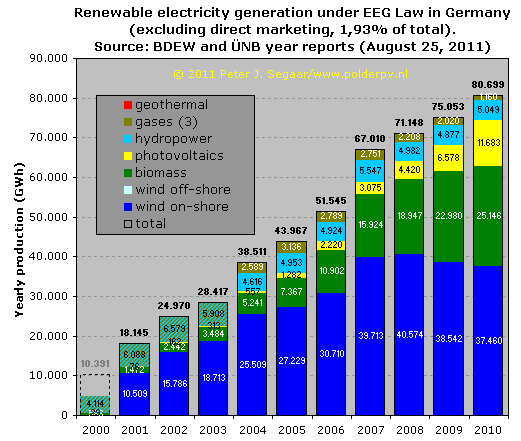
Fig.
2
In this graph only the renewable electrictiy production eligible for EEG
feed-in tariffs (German: "Einspeise Vergütung") is given
for each year, split-up into the the main components given by BDEW and
the ÜNB's in their yearly overviews. The results of all components
are stacked, total production per year is given (in GWh) in bold numbers
on top of each column. Data for wind off-shore and for geothermal production
are not shown (minor contributions, not visible on the present scale).
Note
that the results for the year 2000 are only available as of the first
of April, the official start of the EEG Law in Germany (hence: 2000 "under
represented"). Also please note that the main component "gases"
(landfill-, water purification-, and natural gas from coal mines) has
been incorporated in the "hydropower" data up till 2003 (hatched
column segments).
Total
renewable electricity production under the EEG Law preconditions has accumulated
to a spectacular 80,7 Terawatthours in 2010, with no end in sight.
Having
strongly grown in the earlier years, windpower has slackened off due to
a combination of poor wind years and decommissioning and/or retrofit of
many older wind park sites. Biomass has strongly increased, with fermentation
as an important subcategory. Hydropower is a constant with only modest
potential for further increase. Photovoltaics is the fastest grower, rapidly
evolving into one of the most potent renewable electricity sources as
further cost reductions occur the moment this sentence is written. In
a few years time its impact has risen from a status "negligible"
in 2003 to the third place in 2010. Thereby bypassing hydropower in 2009
(reasonable incentives up to 5 MW, larger scale hydropower is only supported
under EEG Law with low incentives and high restrictions). And producing
ten times as much direct solar-derived energy in 2010 as it was delivering
in 2004-2005. In only 5 years time the photovoltaics boom started a true
decentralised revolution in renewable electricity production.
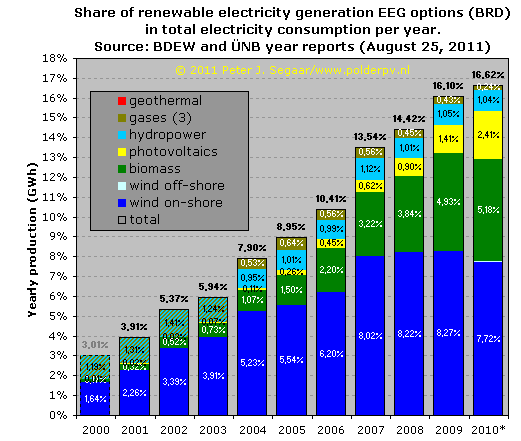
Fig.
3
Figure comparable to that shown in Fig. 2, but now the share of each component
is shown with respect to total electricity consumption (all "types"
included, green to dark grey) in Germany in the same year. While total
EEG "mix" share has already risen to a respectable 16,62%
in 2010, the dominant component still is windpower (although it has been
a very "bad" wind year), with 7,72% of total consumption. Biomass
is second with 5,18%, photovoltaics has reached a level of 2,41%, more
than double the impact of hydropower (with 1,04%). EEG-eligible "green
gases" had only 0,24% and - for now - wind off-shore and geothermal
still are in their nascent stage (4 and 1 promille, respectively).
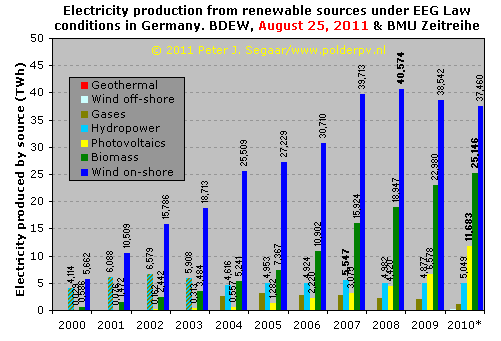
Fig.
4
In this graph the separate options are shown adjacent to each other for
each year, and in the order of impact such as has become apparent in 2010.
Maxima for each option are given in bold numbers (only the minor contributors
have been omitted for clarity). For wind power, 2008 has been the best
year sofar, with 40,6 TWh of physical production under EEG conditions.
Biomass and photovoltaics reached their maximum in 2010, although much
more might be expected as of 2011, of course. A first insight of the strongly
increasing impact was given recently, with photovoltaics claiming already
9,7 TWh production in the first half year of 2011. For table with numbers
and Dutch analysis, see article
published on August 29, 2011. For biomass, production topped at 25,1
TWh in 2010, for the solar colleagues it was already 11,7 TWh in that
full year (equivalent to the maximum year production of almost 3 "Borssele"
nuclear power plants in the Netherlands). Hydropower had its heyday in
2007, with 5,5 TWh (note that the results before 2004 include the "3
gases" later reported separately!). Not shown in numbers, the "gases"
probably peaked in 2005, with 3,1 TWh. It is expected that in particular
wind off-shore will make serious progress if delays in building the complicated,
and expensive wind turbine parks will be solved.
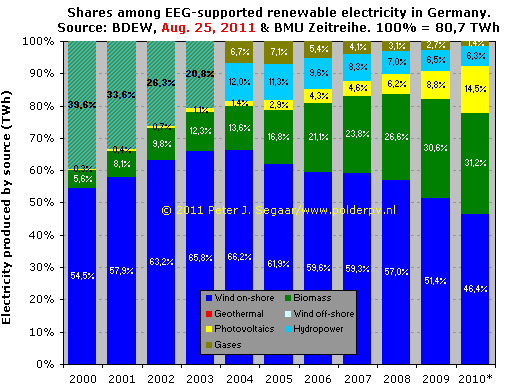
Fig.
5
One hundred percent diagram showing the impact of the various "components"
contributing to the EEG renewable electricity pool in Germany. 100% in
this graph is all EEG electricity, for 2010 that was a volume of 80.699
GWh. That has been a formidable 7,68% increase with respect
to the volume produced in 2009 (74.942 GWh).
In this
graph the diminishing impact of long-time dominator of the German renewable
electricity market, windpower, is apparent. Of course, this can change
if 2011 becomes a "good" wind year, and a considerable contingent
of new wind turbines is being built or older wind parks retro-fitted with
much more powerful apparatuses. Also, the diminishing impact of hydropower
is clear, as well as that for the three "gases". However, in
contrast, the new kids on the block, biomass and photovoltaics, are increasing
their market shares at the cost of the rest. In 2010 these two combined,
already claimed 45,7%. This used to be only 5,9% in the year 2000. Their
collective impact has become almost eight times larger, in only 10 years
time.
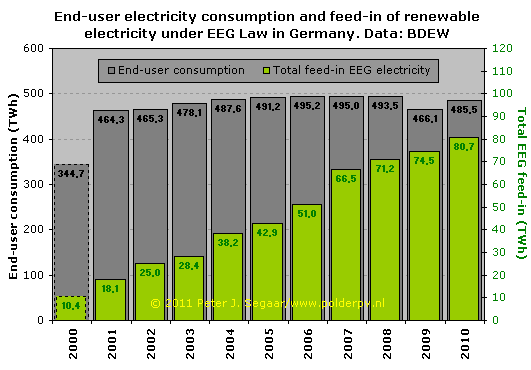
Fig.
6
Impact of EEG-eligible renewable electricity on total consumption of the
"wanted" stuff in Germany. In gray: total consumption (refer
for scale to left Y-axis), taking a temporary plunge in economic crisis
year 2009 (in particular a result of tempered industrial activity), but
regaining strength in 2010 up till 485,5 TWh. That still is almost 2%
less consumption than in record year 2006. Note, again, that 2000 is only
recorded as of April 2000, hence not representative for a "full calender
year".
In green
the EEG electricity production is shown (scale on right Y-axis), with
80,7 TWh already being produced in 2010, resulting in a spectacular 16,62%
share of EEG volume in total electricity consumption in Germany (see Fig.
3). If one realises how heavily industrialized the country is, this
is a phenomenal accomplishment. For which the late Herman Scheer and his
companions should be lauded and praised straight from the heart.
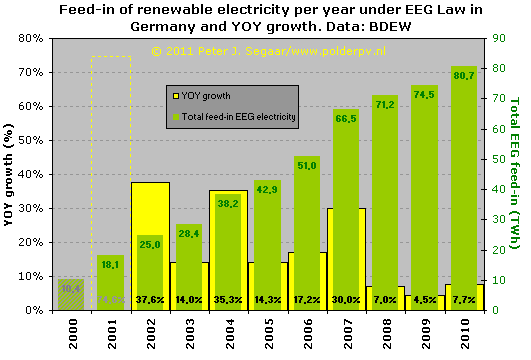
Fig.
7
Realisation of renewable electricity under EEG conditions (green columns
with data on top, right Y-axis), and year-on-year (YOY) growth with respect
to realised energy production volume in the previous year in yellow columns
(data in black, percentage YOY growth, at bottom; left Y-axis). The high
score for 2000-2001 is artificial since the volume for 2000 has not been
established for the whole year (hence: open column with dashed outline).
High growth rates up till almost 38% were seen in the periods 2001-2002,
2003-2004 (EEG Novelle 2004), and in 2006-2007. Because the market has
grown so strong, high YOY data are extremely difficult to maintain. However,
growth rates of 7 to 7,7% in 2008 and 2010, and a respectable 4,5% in
crisis year 2009, are the dream coming true for Germany. Many western
countries see this politically "willed" (r)evolution with envy.
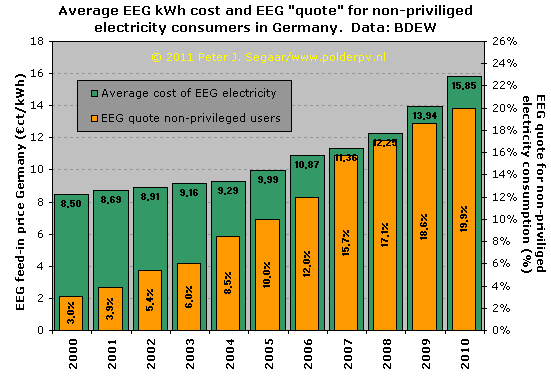
Fig.
8
One of the heaviest contested aspects of the EEG Law is its "costs".
However, many people involved in those "discussions" turn a
blind eye to the benefits and never talk or report about them (for attempt
based on research by BMU, see this page).
This seems to be "one-sided press manipulation", and alas
many people do not dig into the paperwork to get the full picture. "Costs"
are relatively easy to calculate (because of the brilliant structure of
the EEG Law dictating 20 year fixed and clear-cut tariffs that are published
on many websites). The "benefits" however, are rather hard to
decipher. But they are there, of course, and if one calculates them into
the "Big Picture", the EEG Law is cheap in the long run. And
sustainable policy always has to focus on the future, otherwise it can
not be "sustainable" (in the strict sense of the word). Only
stupid, short-sighted politicians do not want to see that, and often they
lead their countries into blind alleys infested with fossils and nukes,
with desasters looming on the horizon.
With
respect to this figure two main data are represented. First the famous
"EEG Quote", which is the ratio between the volume of renewable
kWh's being produced by EEG-eligible sources in a year and the difference
between total electricity consumption and the portion assigned to the
so-called "priviliged parties" in Germany (the companies consuming
huge amounts of electricity, such as aluminium smelters, railways, etc.).
The ratio obtained this way has been the basis for calculating the so-called
"EEG Umlage", the extra fee paid by the "non-priviliged"
parties in German economy: all civilians, associations, and almost all
companies, for each kWh consumed. Even the almost 900.000 PV-system owners,
that still have a normal electricity meter recording their consumption,
must pay that EEG Umlage (status:
3,53 Eurocent/kWh in 2011). The EEG Quote, 19,9% in 2010 (almost one fifth
of electricity consumed should be EEG electricity), is given in orange
columns (refer to right Y-axis for scale).
The second
important feature is the "average cost" of the EEG electricity
that has been paid for to all EEG eligible producers (many different tariffs
for all options, installations sizes, bonuses, etc.). The average is driven
upwards by large amounts of photovoltaic electricity (as of now still
the most expensive type, but with strongest visible and proven cost reduction
of all renewables) and, don't forget about that, biomass, for which many
bonuses are available. After the complete volume of the EEG electricity
has been bought (by the regional net managers), and transferred to the
4 ÜNB's in Germany, it is marketed with priority on the Leipziger
Strombörse. After subtraction of administrative costs, a certain
amount "to be paid" remains. And that amount is divided by the
volume of kWh consumed in a certain year by the "non-priviliged"
parties (a small segment is separated and has to be paid for by priviliged
parties, for max. 0,05 Eurocent/kWh). This results in a certain bonus
on the kWh price to be paid by all German consumers, and that is the magic,
but often misunderstood "EEG Umlage". It is fixed by Bundesnetzagentur
once in the year (mid October, new tariff for the next year), on basis
of prognoses with the latest market data available. Adjustments can be
made afterwards if market realisation has turned out to be significantly
less or above expectations.
There
is discussion with respect to the basic assumptions on which those calculations
are done, but that is beyond the scope of this statistical analysis.
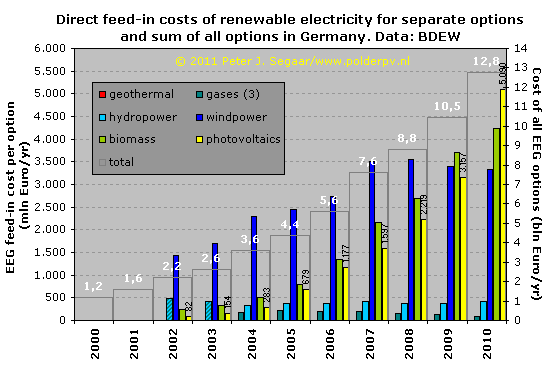
Fig.
9
The subtotals of accumulated feed-in costs paid to the producers of renewable
electricity (coloured columns, refer to left Y-axis) and the total cost
for all options accumulated (broad open columns with gray outline and
white numbers, right Y-axis). Only for photovoltaics the data have been
given separately for clarity in black numbers. Its rapid growth and its
highest tariffs per kWh (although sinking most rapidly as compared to
other options) result in the largest component of the EEG feed-in costs:
in 2010 it has increased to a record 5,1 billion Euro, outrunning the
contributions for windpower (3,3 billion Euro) and even biomass (4,2 billion
Euro). Notwithstanding these "impressive" figures, it remains
a fact of life that all the feed-in together, including that of the also
rapidly evolving biomass options ("expensive" in particular
because of several bonus components), still results in "only"
3,53 Eurocent/kWh extra fee to pay (in the year 2011) for the most impressive
sustainable electricity revolution visible on this planet, see next figure.
Countries can do far worse than that (e.g., Italy will pay a hefty price
due to its far too lucrative feed-in tariffs for solar...).
Total
feed-in costs for all EEG options amounted to 12,8 billion Euro in 2010.
If one does not want industrial revolution in renewables
(and hence: cost reduction due to scale effects), and if one is opposed
to a more liberal, broadly accepted, decentralised, cleaner, power-monger-breaking
monopolistic energetic society, one could say that is
an absurd price to "pay". But young people who grow up in a
world in which multiple amounts of that money (that no one is able to
comprehend what they "should stand for") are wasted on the most
bizarre "economic" scenarios that humanity has seen in Europe,
might think otherwise. So far, the "support" for Greece with
multi-billion dollar "loans" has not resulted in hard, physical
and/or positive spin-off. On the other hand, Germany's EEG Law certainly
does generate crystal-clear results (and: the bill is
paid by its own civilians). Only conservatives might want to abolish such
a succesful mega-operation. Because the succes of the EEG Law is threatening
their position in power politics. If you don't mind about that, it is
good to take a bet on legislation that makes the difference. Germany's
EEG has shown how that can be accomplished.
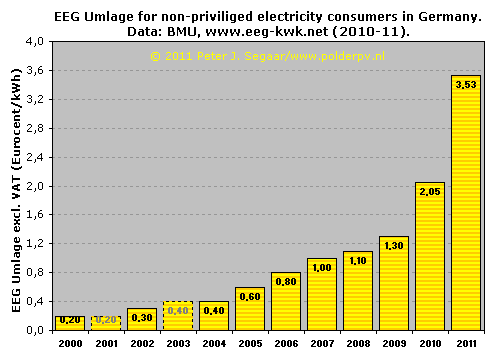
Fig.
10
Development of the EEG Umlage in Germany, the extra fee paid on top of
the kWh price paid by (nearly) all electricity consumers (including the
hundreds of thousands of civilians with a PV-filled roof above their heads).
A combination of factors has driven that fee to the level of 3,53 Eurocent/kWh
for the year 2011. Very strong growth of the solar market is only one
of them (world record sales in 2010 were an important driver for the Umlage
in 2011). The crisis year 2009 another. Less electricity consumption in
Germany is also a driving factor, since a rising amount of EEG electricity
will have to be renumerated from a sinking amount of ("gray")
electricity consumed on the market. If development of the photovoltaic
market is taking the brakes, growth of the Umlage might be stalled or,
in theory, even might become a little less. The bureaucrats of Bundesnetzagentur
will establish the Umlage for 2012 as soon as they have all the hard numbers
available later in 2011.
For the
years 2001 and 2003 no data were available (values estimated).
Background
EEG Umlage
The
EEG Umlage is paid for the amount of money remaining after the following
"operations", starting with the volume of the "raw
feed-in payments" by the hundreds of regional net managers
to the producers: (a) Subtracting the avoided net costs (since EEG
electricity is decentralised, avoiding transport over high-voltage
networks). (b) Compensating for corrections from previous years
(either plus or minus). After these two steps a certain amount of
money to be paid remains. (c) The most important step is the EEG
electricity volume that has to be sold by the ÜNB's on the
Leipziger Strombörse, on a priority basis (before anything
else is being sold on the day-ahead or spot market). The money earned
with those sales is subtracted from the remaining EEG costs. (d)
Administration costs needed to realise the sale of the EEG electricity
are added. Only than an amount of money remains, that has to be
renumerated. This is a sum far lower than the original accumulation
of all the feed-in costs, and this is what the Germans mention the
"Differenzkosten" ("difference costs") between
feed-in payments and "market price" obtained for the green
product.
That
is the amount to be paid, and that is distributed among the volume
of kWh's used by all "non-privileged" electricity consumers
(including all PV-system owners), as metered via their consumption
meters. Amount of money in Euro divided by the amount of kWh consumed
"on the non-priviliged market" gives the value of the
EEG-Umlage for the next year. |
Note:
For the only slightly increased EEG Umlage for the year 2012 (€ct
3,592), see analysis
published October 16, 2011 (including updated graph).
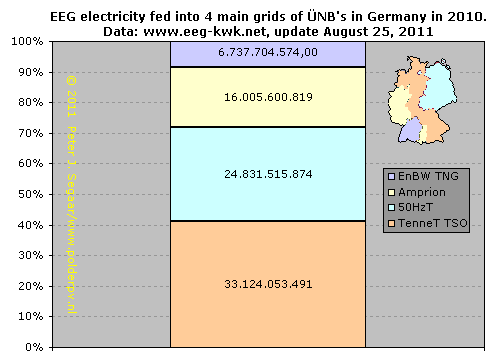
Fig.
11
EEG electricity production distiributed among the four big ÜNB's
(high-voltage network manager regions, for gross location see small map)
in 2010 in Germany. 100% scale = 80,7 TWh. Shares differ between the ÜNB's,
with high impact on the former E.ON net manager region, that has been
taken over by Dutch high-voltage network owner TenneT, and now is named
TenneT TSO (orange segment). It has 33,1 TWh of total EEG production in
its large region (41%), which includes the wind turbine rich northwestern
part of Germany, as well as the largest part of Bavaria, which is world
champion in the realisation of PV-installed capacity (end of 2010 app.
6,4 GWp).
East
Germany, which has been the area covered by (Swedish) Vattenfall's high-voltage
net manager, now is under control of independent 50HzT (with participation
of Belgium's net manager ELIA; light blue segment). It includes massive
amounts of wind turbine capacity, to which in recent years also an impressive
portfolio of huge PV-parks is being added (several in the active state
of Brandenburg). Hamburg ("city state") is also included in
the 50HzT area. The producers on the premises of the 50HzT managers have
generated 24,8 TWh of total EEG contributions, 31% of the volume.
The next
of the four ÜNB regions is the one formerly attributed to the big
RWE utility company, with its core in Germany's most heavily populated
Ruhrgebiet area with lots of coal power plants (black coal and lignite
firing installations). A large region bordering France, Belgium and the
southeastern part of Netherlands, with the peculiar addition of the western
part of Bavaria (hence adding a lot of photovoltaic capacity on top of
the volume of the most popular of renewables in Nordrhein-Westfalen).
Its region is now under control of independent Amprion (with support by
Commerz Real), produced over 16 TWh in 2010, and thus had a share of 20%
in total EEG-paid electricity generation.
Finally,
the rest, 6,7 TWh has been generated on the soil of the relative modest
ÜNB region of EnBW TNG, where Germany's renewable revolution has
been initiated with the anti-nuclear protest movement in and around Baden-Württemberg's
student city Freiburg, long ago. It produced over 8% of total EEG volume.
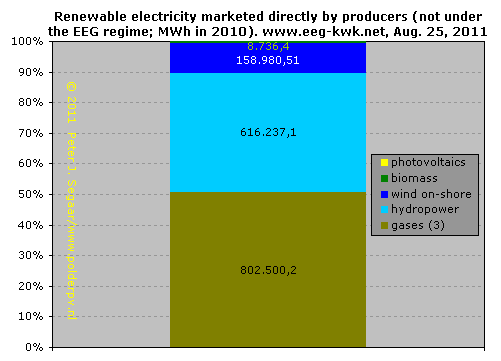
Fig.
12
Beyond the EEG feed-in, it is possible in Germany to market the renewable
electricity by yourself, and try to get a good price for the wanted product.
This is called "Direktvermarktung". There is
a very strict clausule in the EEG Law that explicitly forbids "double-sale"
("Doppelvermarktung") of EEG-eligible (and accepted) electricity.
Hence: if one chooses to market the electricity (this can be done for
each month separately), any application for EEG-based feed-in tariffs
is automatically blocked. Direktvermarktung is also registered and administered
by the ÜNB administrations, for which the first result for 2010 is
shown in the figure above.
Although
the volumes traded as such are not yet large (100% in this figure stands
for a volume of "only" 1,59 TWh, which is only 2% of the volume
of electricity attributed to the EEG mechanism), they will have to grow,
since it is the explicit will of the German government that renewables
will ultimately be fully incorporated in the "market place"
(whatever that is).
Most
striking in the graph depicted above is the dominant factor "gases",
with 803 GWh claiming almost 51% of this young market in 2010, followed
by hydropower with 616 GWh (39%), and wind on-shore (159 GWh, 10%). Of
course, the first two options are highly predictable sources. Wind on
land is fairly well predictable, and Germany has massive amounts of wind
power in live production. Biomass and photovoltaics have been mentioned
in the data, but their contributions (probably resulting from the magnitude
of the offered "market price") are negligible: 0,6% for biomass,
only 1 promille for photovoltaics. Of course, this might change in the
near future.
Links
EEG production year
reports originally published by BDEW, now to be found on the collective
website of the high-voltage network managers, "EEG-KWK.net":
http://www.eeg-kwk.net/de/EEG_Jahresabrechnungen.htm
BDEW
= Bundesverband der Energie- und Wasserwirtschaft
BMU
= Bundesministerium für Umwelt und Reaktorsicherheit (Environment
Ministry)
BNA
= Bundesnetzagentur
ÜNB = Übertragungs-Netzbetreiber (companies responsible for
the high-voltage network and for grid balance in Germany). Their collective
website is named EEG-KWK.net.
Erneuerbare
Energien = special website of BMU exclusively devoted to renewable
energy full with hard core data and many, many graphs on the renewable
energy revolution in Germany.
Webpagina
gepubliceerd dd. 23 september 2011.
|
