 Accumulation:
  installations
Animate!:
put mouse pointer over the graph and animation will start automatically.*
Interactive!: move
mouse pointer over buttonbar and corresponding image will show.
At the same time in the interactive mode, accumulation of installations will
show in red-lined yellow field.
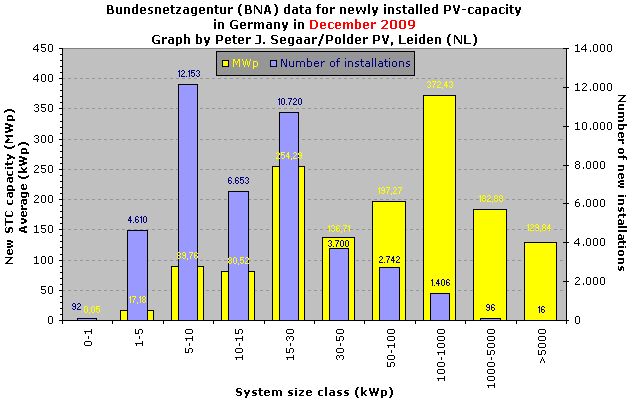
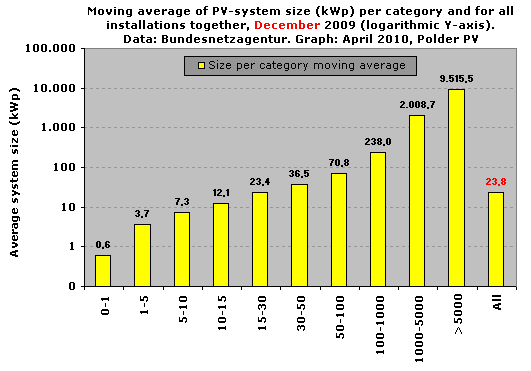
In the
following graph the distribution of new 2009 installations among
kWp classes is given: number of new installations as well as total
installed new capacity in that class, per month. Classes have been
defined by Polder PV (note that "1-5" stands for: class containing
installations from > 1 kWp up till, and including installations from
exactly 5 kWp). The demarcations in Germany's EEG Law are 0-30, 30-100,
100-1.000, and over 1.000 kWp (no upper limits for installation size).

Animate!:
put mouse pointer over the graph and animation will start automatically.*
Interactive!:
move mouse pointer over buttonbar and corresponding image will show.

Animate!:
put mouse pointer over the graph and animation will start automatically.*
Interactive!:
move mouse pointer over buttonbar and corresponding image will show.

Animate!:
put mouse pointer over the graph and animation will start automatically.*
Interactive!:
move mouse pointer over buttonbar and corresponding image will show.

Animate!:
put mouse pointer over the graph and animation will start automatically.*
Interactive!:
move mouse pointer over buttonbar and corresponding image will show.
|
^^^
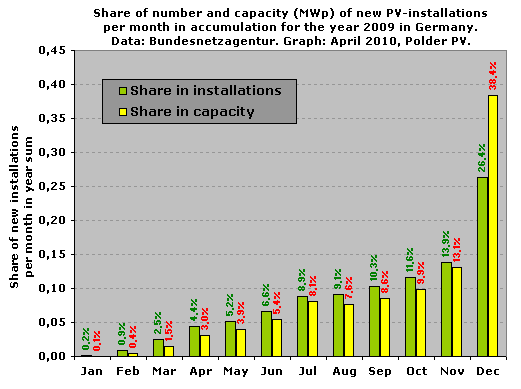
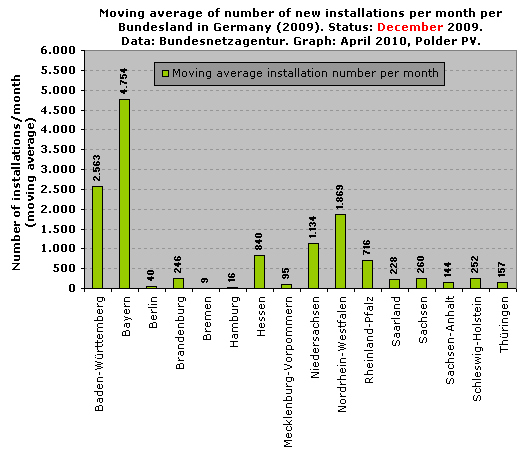
Example of calculation for July 2009:
14.210 new PV installations in Germany (green columns), with total capacity
of 307,4 MWp (yellow columns); 159.852 new installations in 2009, with total
capacity of 3.806,3 MWp. Share of July 2009: 14.210/159.852 = 8,9% in installations,
and 307,4/3.806,3 = 8,1% in MWp installed.
Almost
every next month had larger shares in comparison with the previous
ones. The only deviation: new capacity reported in the holiday
month of August. After that, capacity strongly increased again.
Note the very large shares of December in the yearly total, in particular
with respect to MWp installed (38,4% of total new year capacity), the combined
result of many large PV-systems as well as many thousands of smaller installations
(total: 42.188 in this month only...) reported as connected
to the grid to Bundesnetzagentur. |
 |
^^^
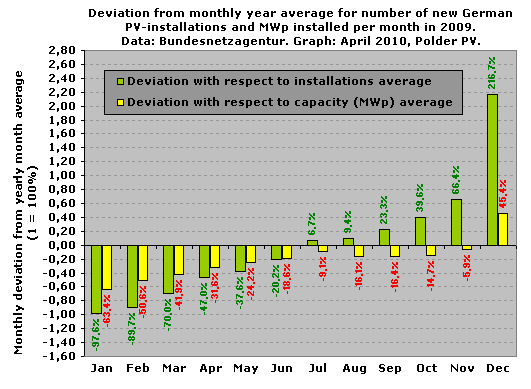
Graph comparable to previous one, but here the
deviation of the outcome per month has been shown in % with
respect to the yearly average
for number of new installations per month (green) and MWp newly
installed per month (yellow). Up till the early
summer month June the number of new installations was below the
yearly average, but after that it grew beyond that mark. December
showed a spectacular end of year rush to install (and report
to Bundesnetzagentur) before the new feed-in tariffs (fixed into
EEG Law) would be introduced as per January 1, 2010.
MWp
installed remained below the yearly month average up till November
2009: the capacity claimed in December was so huge, that only
that
month rose far beyond that mark, thereby putting all other months
far behind, all falling below the yearly average.
|
* Withdrawing
mouse pointer away from the image will stop the animation and will
give the end of year status (december image).
Note that
it is possible that with some combinations of operating systems and
web browsers, the dynamic elements on this webpage might not work well.
It does work with a Windows XP - Firefox and/or Internet Explorer combination.
One person encountered problems with an usb-booted Opera 10.0 browser
on a Windows XP system. Please mail
me if you encounter problems (and:
if you might know of any solutions).
Source:
Bundesnetzagentur
http://www.bundesnetzagentur.de/cln_1932/DE/Sachgebiete/ElektrizitaetGas/ErneuerbareEnergienGesetz/VerguetungssaetzePhotovoltaik_Basepage.html
For more
information about Germany's 2009 market (including production data
released by the BDEW administration), visit the separate
web page on this website (in Dutch, with English captions
with the figures).
This service is provided
to you by the private initiative Polder
PV from the Netherlands for
better understanding of the promises of solar energy. In the world
market Germany already revolutionizing the archaic energy system
that is threatening the existence of human society.
Web page conceived following publication of the December 2009 results
by Bundesnetzagentur on April 9, 2010. First upload: April 14, 2010.
